Social Network Business Market Analysis Chart – Effective Data Visualization
RJ0400070_16
- Last Update 06/06/2025
- File Size 5.9MB
- # of Slides 2
- File Format PPTX
- Slide Ratio 16:9
- Color
Keywords
- #Content-Based Slides
- #Design-Based Slides
- #Market and Competitor Analysis
- #Graph
- #Competitor Analysis
- #Market Analysis
- #Horizontal Bar
- #Grouped Horizontal Bar
- #16:9
- #horizontal bar chart PowerPoint
- #bar graph slide template
- #data comparison chart
- #market analysis PPT
- #competitive analysis slide
- #numerical comparison presentation
About the Product
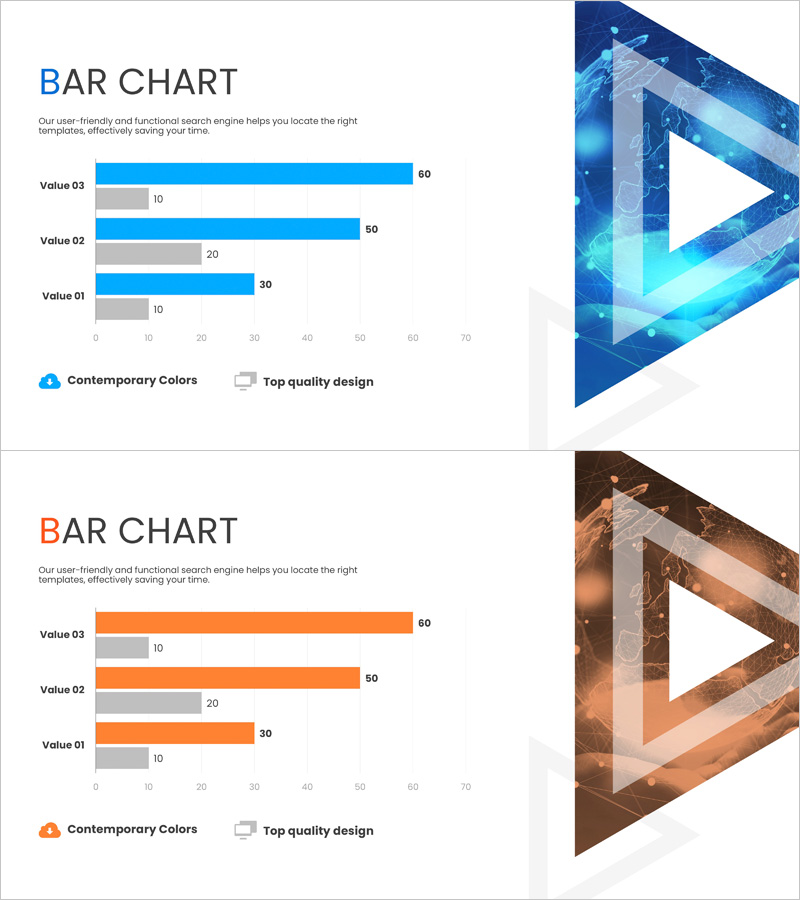
A professional horizontal bar chart PowerPoint slide set featuring 2 slides optimized for market analysis and competitive comparison. The design uses a dual-tone color scheme of blue and orange, with each slide displaying 3 data items for side-by-side numerical comparison. Primary and secondary values are shown together, enabling multi-layered data communication suitable for corporate presentations, business reports, and marketing plans. Delivered in 16:9 widescreen PPTX format for universal compatibility across all presentation platforms.
Usage Points
-
Main Usage
Enables clear visual comparison of multiple data points in corporate presentations, emphasizing rankings and relative performance. Effectively visualizes quantitative data such as market size, revenue, market share, and performance metrics, improving audience comprehension and supporting decision-making.
-
How to Use
Replace the Value 01–03 labels and numerical data with your own information. Use the blue bars for primary metrics and orange bars for comparison targets, or segment by time period, region, or product category. Axis ranges and labels adjust automatically to accommodate your data.
-
Recommended For
Ideal for marketing team market analysis presentations, sales team competitive reports, executive performance briefings, consulting proposals, and business plan documents. Recommended for any business presentation requiring 2–5 item numerical comparisons.
-
Slide Structure
2-slide set. Each slide contains 3 data items (Value 01, 02, 03) with paired horizontal bars (primary and secondary values). Horizontal axis ranges from 0–70 with item labels and numerical indicators. Dual-tone color scheme in blue and orange series for contrast emphasis.
Related Products
-

Medical Record Analysis Bar Graph – Market and Competitor Analysis
#Market and Competitor Analysis #Graph #Competitor Analysis
-

Horizontal Bar Graph for Competitor Analysis – Effective Data Visualization
#Market and Competitor Analysis #Graph #Competitor Analysis
-

Mobile App Usage Analysis Graph – Insights for Competitor Analysis
#Market and Competitor Analysis #Graph #Competitor Analysis
-

Comparative Analysis Bar Graph – Data-Driven Market Insights
#Market and Competitor Analysis #Graph #Competitor Analysis
