Competitor Website Analysis Graph – Market and Competitor Analysis
RJ0400041_8
- Last Update 05/28/2025
- File Size 0.2MB
- # of Slides 2
- File Format PPTX
- Slide Ratio 16:9
- Color
Keywords
- #Content-Based Slides
- #Design-Based Slides
- #Market and Competitor Analysis
- #Graph
- #Competitor Analysis
- #Market Analysis
- #Horizontal Bar
- #Grouped Horizontal Bar
- #16:9
- #grouped horizontal bar chart PowerPoint
- #dual-series bar graph template
- #competitor analysis slide
- #market comparison chart
- #data comparison PowerPoint template
About the Product
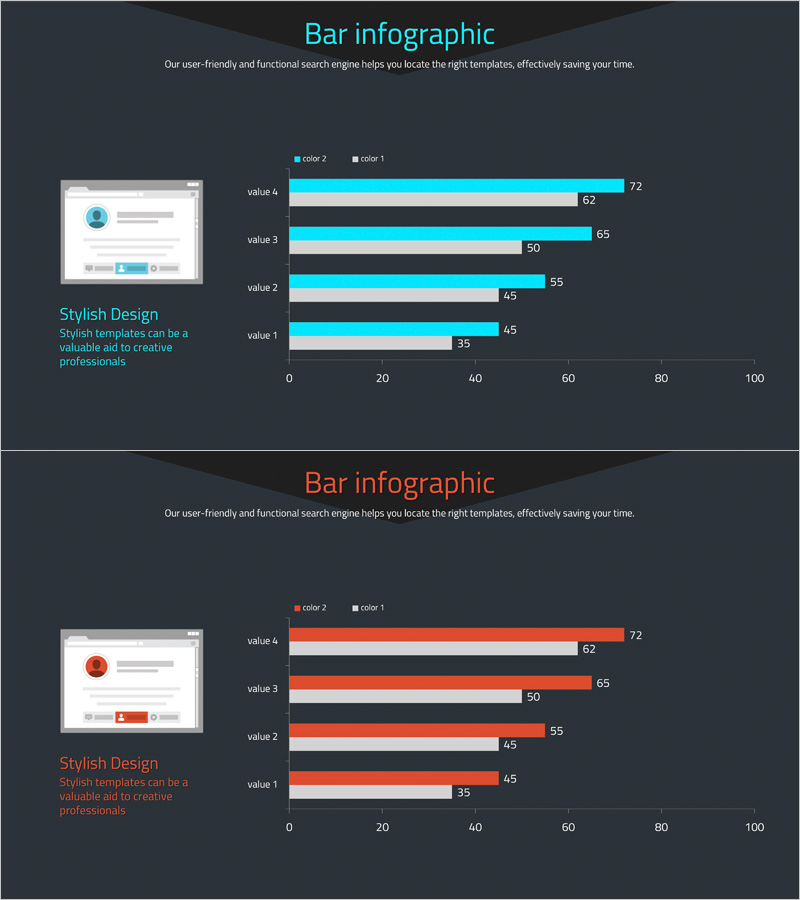
A grouped horizontal bar chart PowerPoint slide designed for competitor website analysis and market comparison. This 2-slide template offers two color themes: Theme 1 with cyan and dark gray, and Theme 2 with red and dark gray. Each slide displays 5 data items (value 1 through 6) with dual-series bars positioned side-by-side, enabling direct numerical comparison between competitors. The horizontal axis ranges from 0 to 100 with clear legend indicators, making data interpretation intuitive. A left-side thumbnail area with 'Stylish Design' descriptive text enhances presentation professionalism. Provided in fully editable PPTX format, allowing quick data input and customization for your specific analysis needs.
Usage Points
-
Main Usage
Visualizes two-series numerical data such as competitor website metrics, market share, customer satisfaction scores, or performance benchmarks. The 5-item layout enables side-by-side comparison of your company against competitors, facilitating strategic decision-making, competitive positioning analysis, and executive reporting.
-
How to Use
Replace the placeholder text (value 1–6) and numerical values (35–72) with your actual data. Select one of the two color themes to match your corporate branding, and adjust colors as needed. Ensure the legend (color 2 and color 1) clearly identifies each data series for audience comprehension.
-
Recommended For
Marketing professionals, strategy planners, executives, consultants, and business analysts presenting competitive analysis, benchmarking results, or market research findings. Ideal for business plans, investor pitch decks, executive reports, marketing strategy presentations, and any formal presentation requiring quantitative comparative analysis.
-
Slide Structure
2-slide template. Each slide features a title area (top center), left-side thumbnail with descriptive text, and right-side bar chart area. The chart displays 5 items with dual-series horizontal bars, 0–100 horizontal axis scale, numerical value labels, and a clear legend distinguishing the two data series.
Related Products
-

Market Analysis Bundle Bar Graph - Effective Competitor Analysis
#Market and Competitor Analysis #Graph #Competitor Analysis
-

Medical Record Analysis Bar Graph – Market and Competitor Analysis
#Market and Competitor Analysis #Graph #Competitor Analysis
-

Horizontal Bar Graph for Competitor Analysis – Effective Data Visualization
#Market and Competitor Analysis #Graph #Competitor Analysis
-

Social Network Business Market Analysis Chart – Effective Data Visualization
#Market and Competitor Analysis #Graph #Competitor Analysis
