Work Performance Analysis Graph – Visually Representing Employee Performance
RJ0300048_7
- Last Update 05/01/2025
- File Size 6.2MB
- # of Slides 2
- File Format PPTX
- Slide Ratio 16:9
- Color
Keywords
- #Content-Based Slides
- #Design-Based Slides
- #Market and Competitor Analysis
- #Graph
- #Other
- #Customer Analysis
- #Market Analysis
- #Circles
- #Doughnut Chart
- #Silhouette
- #16:9
- #silhouette PowerPoint slide
- #employee performance analysis
- #competency assessment diagram
- #progress bar slide
- #performance evaluation template
About the Product
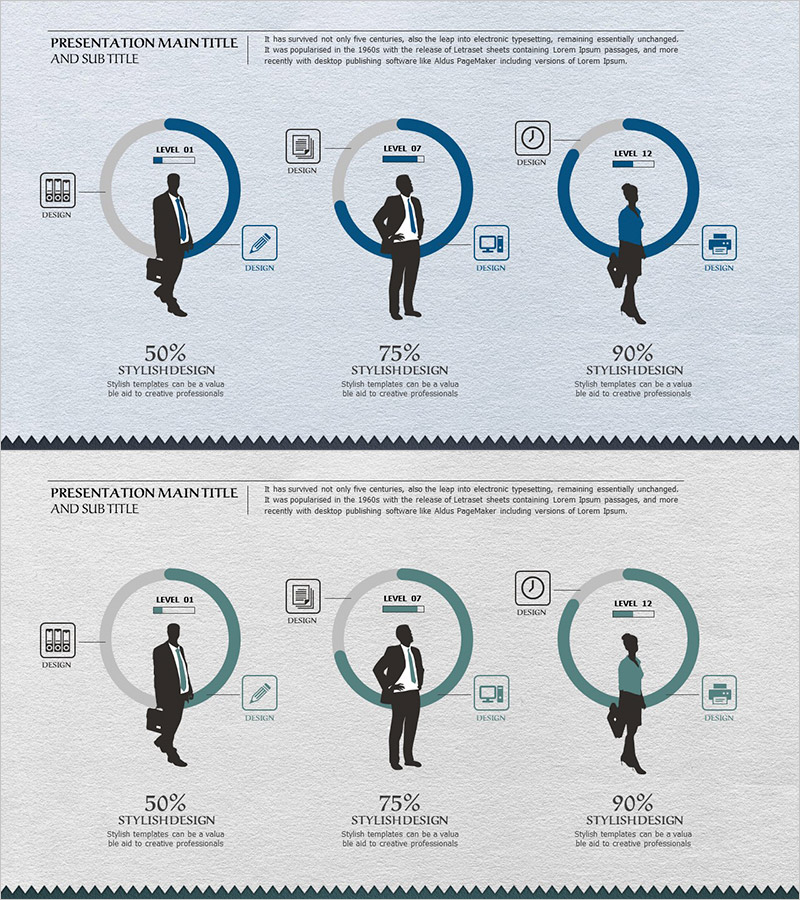
A professional PowerPoint slide featuring silhouettes of businesspeople to visualize employee performance across three competency levels. Three businessman silhouettes are arranged in circular progress diagrams representing Level 01, 07, and 12, with achievement rates of 50%, 75%, and 90% respectively. The dark blue and light gray color scheme conveys professionalism, while contextual icons (calendar, pen, clock, printer) at each level provide intuitive insight into job responsibilities. This presentation slide effectively communicates organizational competency development, performance evaluations, and career progression stages through the combination of human silhouettes and circular progress indicators.
Usage Points
-
Main Usage
This slide clearly represents employee competency levels across multiple stages within an organization. It is designed for performance review meetings, talent development planning presentations, and career progression explanations, transforming abstract competency concepts into concrete visual representations with percentages.
-
How to Use
Customize the three silhouettes and circular progress bars to match your organization's actual job levels or team members. The 50%, 75%, and 90% percentages can be freely adjusted to represent performance achievement rates, competency levels, or goal completion metrics. Add icons and text at each stage to describe specific job responsibilities and competency requirements.
-
Recommended For
HR professionals, organizational development specialists, team leaders, and executives presenting employee performance evaluations, talent development strategies, and organizational structure explanations. Particularly effective for illustrating multi-stage growth models, hierarchical responsibility ranges, and team role distribution.
-
Slide Structure
Two-slide set featuring three dark blue circular progress bars arranged horizontally on each slide, with black businessman silhouettes centered within each circle. Four contextual icons (calendar, pen, clock, printer) are positioned on the left side, with percentage labels (50%, 75%, 90%) and descriptive text at the bottom. Formatted in 16:9 widescreen for optimal compatibility with modern presentation environments.
Related Products
-

User Analysis Donut Chart – Optimal for Market and Competitor Analysis
#Market and Competitor Analysis #Graph #Other
-

Global Business PowerPoint Template Wide Donut Chart
#Market and Competitor Analysis #Graph #Customer Analysis
-

Market Demand Analysis PowerPoint Slide – Donut Chart Layout
#Market and Competitor Analysis #Graph #Customer Analysis
-

Stylish Design Business Presentation Template
#Market and Competitor Analysis #Graph #Market Status
