Orange Hexagon Presentation Template Segmented Vertical Bar Graph – Market and Competitive Analysis
RJ0200038_17
- Last Update 04/08/2025
- File Size 0.8MB
- # of Slides 2
- File Format PPTX
- Slide Ratio 16:9
- Color
Keywords
- #Content-Based Slides
- #Design-Based Slides
- #Market and Competitor Analysis
- #Graph
- #Other
- #Customer Analysis
- #Market Analysis
- #Column
- #Segmented Column
- #Silhouette
- #16:9
- #vertical bar chart PowerPoint
- #market analysis slide template
- #competitive analysis chart
- #4-series bar graph
- #data visualization PowerPoint slide
- #how to create bar chart in PowerPoint
About the Product
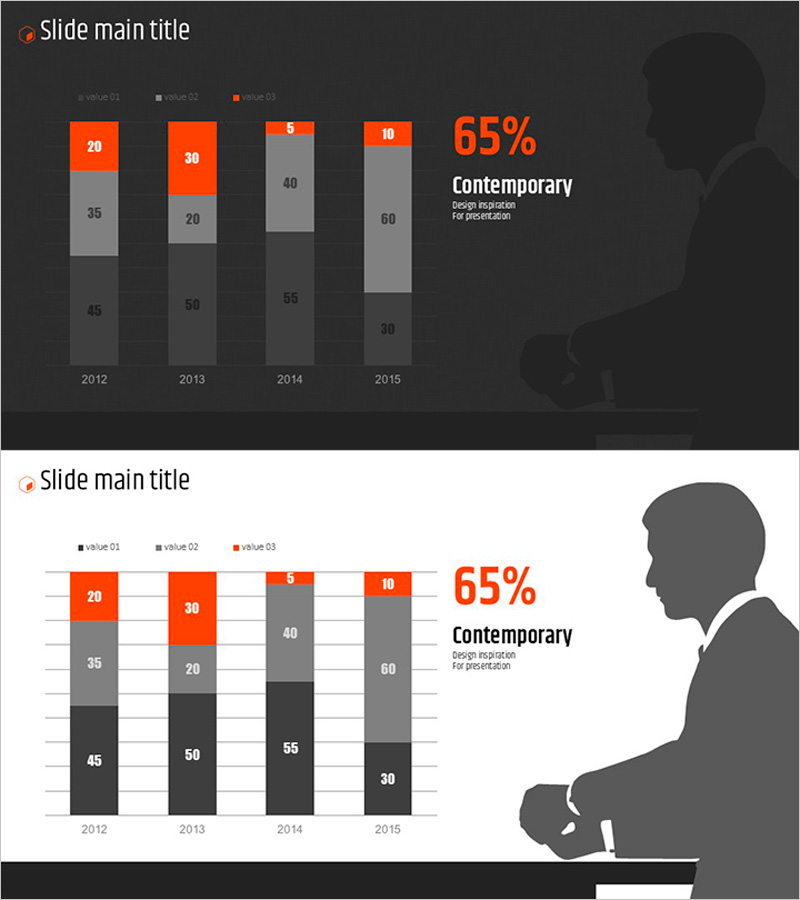
A vertical bar chart PowerPoint slide optimized for market analysis and competitive comparison. This presentation template visualizes four data series from 2012 to 2015, using orange accent color contrasted with gray and black tones to highlight key metrics. The right side features a silhouette illustration and 65% percentage indicator to emphasize primary data points. The dark background combined with white typography ensures high readability in projection environments. Instantly applicable to business presentations, reports, and proposals.
Usage Points
-
Main Usage
Clearly compare and analyze multi-series numerical data such as market size, competitor performance, and year-over-year trends. The four-series arrangement by year enables viewers to instantly grasp temporal changes and relative magnitude differences between data categories.
-
How to Use
Deploy in market analysis sections, competitive landscape presentations, revenue trend reports, and business performance briefings. The silhouette illustration and 65% percentage indicator on the right emphasize key messages, while the dark background provides optimal visibility when projected in standard meeting environments.
-
Recommended For
Recommended for executives, marketing teams, sales departments, and strategic planning teams presenting market conditions, competitive analysis, and performance reports. Ideal for business plans, investor pitch decks, quarterly reports, and proposals requiring data-driven decision-making.
-
Slide Structure
2-slide set. Slide 1: Dark background with four vertical bars (2012–2015) representing four data series (value 01–03 plus accent series), right-side silhouette illustration, 65% metric, and 'Contemporary' label. Slide 2: Light background version with identical structure. 16:9 widescreen format, PPTX file.
Related Products
-

Gender Ratio Customer Analysis 3D Circle Graph – Insights for Market Understanding
#Market and Competitor Analysis #Graph #Other
-

User Analysis Donut Chart – Optimal for Market and Competitor Analysis
#Market and Competitor Analysis #Graph #Other
-

3D Segmented Bar Graph for Performance Analysis – Market Trends
#Market and Competitor Analysis #Graph #Customer Analysis
-

Visualizing the Changing Trend of the Ageing Population with a 100% Stacked Bar Graph
#Business Strategy #Market and Competitor Analysis #Marketing Plan and Strategy
