Athlete Competency Chart for Standardized Customer Analysis – Strengthening Competitiveness
RJ0600052_4
- Last Update 07/04/2025
- File Size 0.5MB
- # of Slides 2
- File Format PPTX
- Slide Ratio 16:9
- Color
Keywords
- #Content-Based Slides
- #Design-Based Slides
- #Company Introduction
- #Market and Competitor Analysis
- #Graph
- #Other
- #Manpower
- #Customer Analysis
- #Circles
- #Pie Chart
- #Silhouette
- #16:9
- #pie chart PowerPoint slide
- #silhouette presentation template
- #ratio analysis chart
- #customer analysis slide
- #circular graph design
About the Product
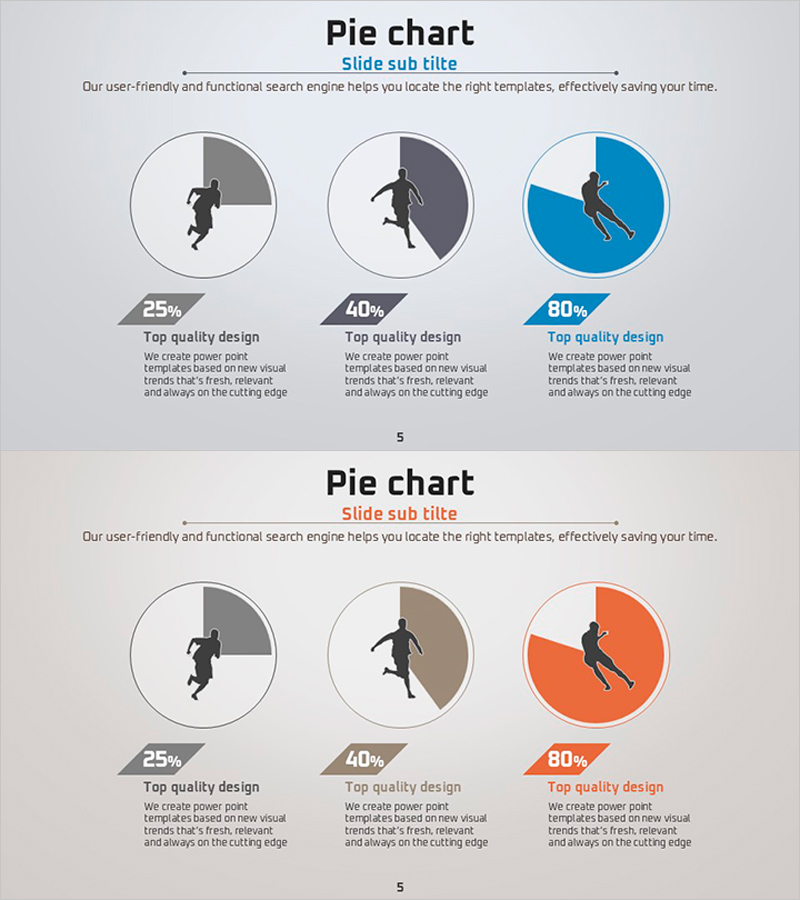
A PowerPoint pie chart slide featuring athlete silhouettes for competency visualization. Three pie segments display human figures in silhouette form, ideal for customer analysis, market analysis, and competitive strength evaluation. The color palette combines gray, charcoal, and blue tones to convey professionalism. Each segment includes percentage values and descriptive text labels below. Perfect for presentations, reports, and strategic proposals that require ratio-based data visualization.
Usage Points
-
Main Usage
Compares three key performance indicators—customer competency, market share, and competitive advantage—using a pie chart format. Silhouette figures in each segment represent human resources, organizational capability, or team composition. Percentage values paired with descriptive text support data-driven decision-making and strategic analysis.
-
How to Use
Apply this slide in sales presentations, executive reports, marketing strategy documents, and organizational analysis materials. Replace percentage values with actual data and update text labels below each silhouette with relevant category names. Customize colors to match your organization's brand guidelines. Ready for immediate use with minimal editing.
-
Recommended For
Sales teams presenting customer analysis, executives delivering market reports, marketing departments evaluating competitive positioning, HR teams analyzing organizational capability, and consultants preparing strategic proposals. Suitable for any business presentation requiring ratio-based comparative analysis and visual impact.
-
Slide Structure
2-slide deck. Slide 1: Three-segment pie chart (gray 25%, charcoal 40%, blue 80%) with silhouette figures positioned in each segment, percentage labels and 'Top quality design' text below. Slide 2: Identical layout with alternate color scheme (gray, tan, orange tones). 16:9 widescreen format, PPTX file.
Related Products
-

Drug Addiction Gender Ratio Analysis Graph - Customer Analysis
#Market and Competitor Analysis #Graph #Other
-

Gender Ratio Customer Analysis 3D Circle Graph – Insights for Market Understanding
#Market and Competitor Analysis #Graph #Other
-

Businessperson Ability Assessment Slide – Visualizing Expertise Levels
#Company Introduction #Market and Competitor Analysis #Diagram
-

Bar Graph Visualizing Elderly Population Ratio
#Market and Competitor Analysis #Graph #Other
