Simple Car Presentation Diagram & Pie Chart – Optimized for Market Analysis
RJ0200057_27
- Last Update 04/15/2025
- File Size 0.5MB
- # of Slides 2
- File Format PPTX
- Slide Ratio 16:9
- Color
Keywords
- #Content-Based Slides
- #Design-Based Slides
- #Market and Competitor Analysis
- #Diagram
- #Graph
- #Competitor Analysis
- #Market Share
- #Cluster
- #Circles
- #Closed Cluster Diagram
- #Pie Chart
- #16:9
- #pie chart PowerPoint slide
- #pie graph template
- #data visualization slide
- #market share chart
- #sales composition PPT
- #ratio chart download
About the Product
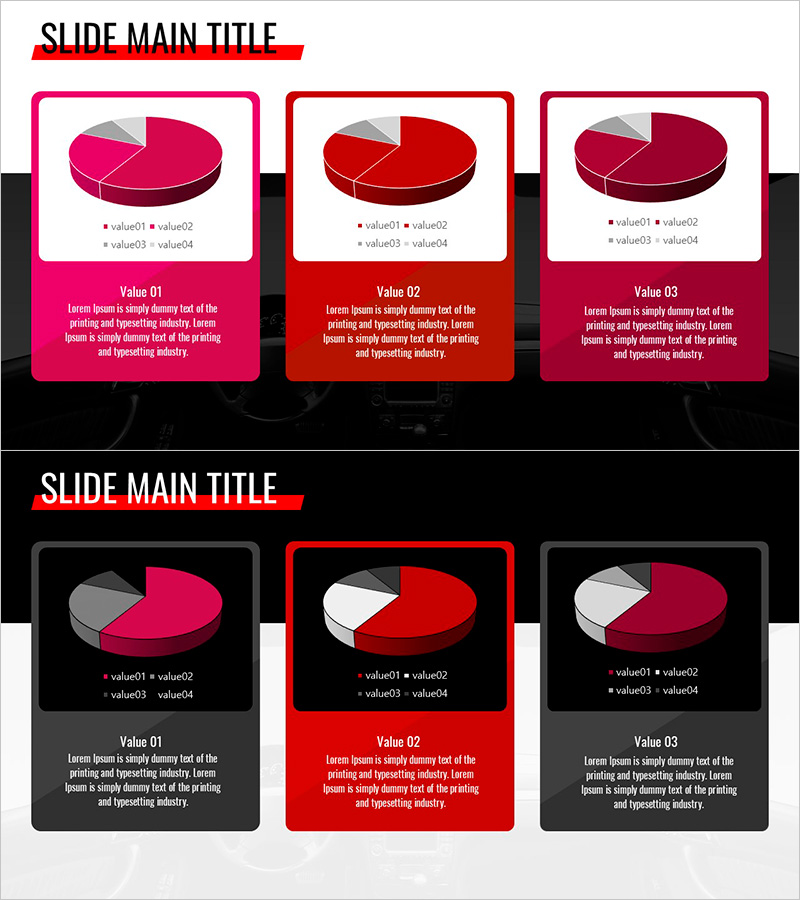
A professional pie chart PowerPoint slide template featuring three-segment data visualization in pink, red, and wine color tones. This 2-slide presentation deck includes four legend items (value01–value04) per slide, enabling detailed market share analysis, competitive comparison, and sales composition breakdown. The 16:9 widescreen format ensures compatibility with modern presentation environments. Ideal for financial reports, marketing analysis, business strategy presentations, and executive briefings requiring clear ratio-based data representation.
Usage Points
-
Main Usage
Visualize market share, sales composition, competitive positioning, customer distribution, and budget allocation using pie chart format. The three-color scheme (pink, red, wine) ensures clear differentiation between data segments and enhances audience comprehension during presentations.
-
How to Use
Insert into financial reports for revenue analysis, marketing presentations for market segmentation, and business strategy documents for competitive comparison. Edit legend items and values with actual data, then deploy directly in quarterly earnings calls, investor meetings, or board presentations.
-
Recommended For
Finance teams presenting quarterly results, marketing departments analyzing market segments, management executives in strategy sessions, consulting firms delivering client reports, and investment professionals preparing pitch decks. Suitable for banking, insurance, retail, and manufacturing sectors.
-
Slide Structure
Slide 1: Pink-tone 3-segment pie chart with 4 legend items and data labels / Slide 2: Red & wine-tone 3-segment pie chart with 4 legend items. Each slide combines chart visualization with text explanation area for comprehensive data interpretation.
Related Products
-

Market Share Comparison 3D Pie Chart – Market Insight
#Market and Competitor Analysis #Diagram #Graph
-

Pie Chart of Composition Ratio by Fashion Type – The Start of Data Visualization
#Company Introduction #Market and Competitor Analysis #Diagram
-

Animal Trait Distribution Pie Chart – Market and Competitor Analysis
#Market and Competitor Analysis #Diagram #Graph
-

Pie Chart of the Development Status of the Snow Mountain Theme
#Product/Service Introduction #Market and Competitor Analysis #Diagram
