Pie Chart for Workout Type Preferences – Market Status
RB0600006_4
- Last Update 03/14/2025
- File Size 1.2MB
- # of Slides 2
- File Format PPTX
- Slide Ratio 4:3
- Color
Keywords
- #Content-Based Slides
- #Design-Based Slides
- #Market and Competitor Analysis
- #Diagram
- #Graph
- #Market Status
- #Market Share
- #Cluster
- #Circles
- #Closed Cluster Diagram
- #Pie Chart
- #4:3
- #pie chart PowerPoint slide
- #3D pie graph template
- #data comparison chart
- #market share analysis slide
- #ratio visualization template
About the Product
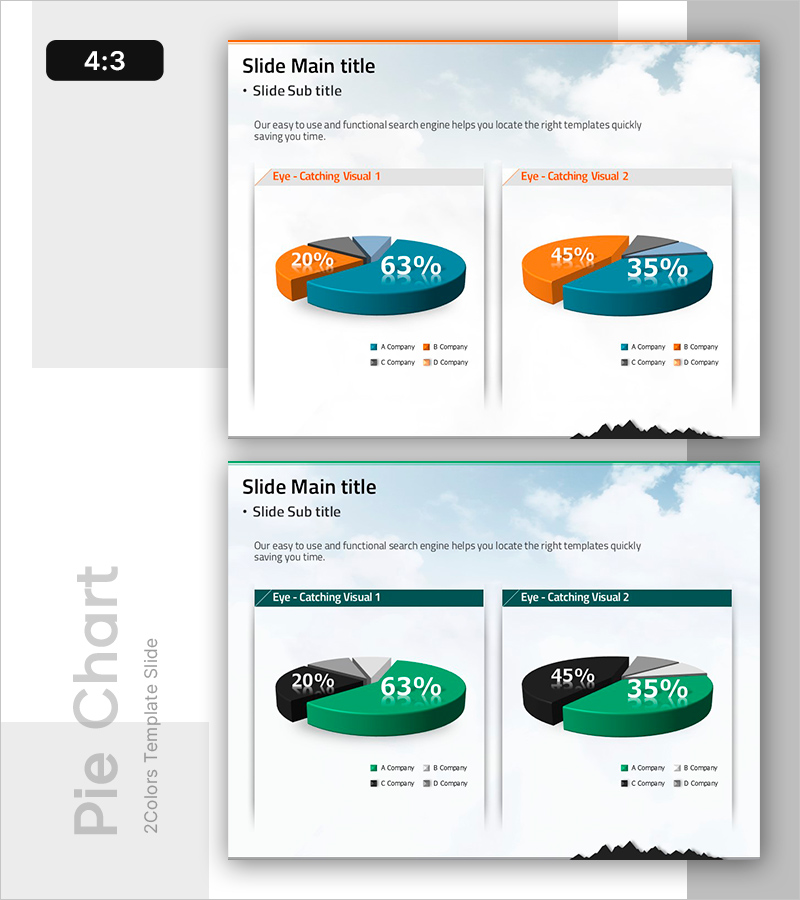
A professional 3D pie chart PowerPoint slide template designed to visualize workout type preferences and market share distribution. Features two side-by-side pie charts with orange and teal gradient styling, enabling direct comparison of different datasets. Each chart displays four items (A through D Company) with clear percentage labels and 3D depth effects for enhanced visual impact. This 4:3 aspect ratio template with 2 slides is ready to use for market analysis presentations, customer preference surveys, sales reports, and competitive positioning discussions in business environments.
Usage Points
-
Main Usage
Designed to compare proportions and market share across four categories such as workout types, product lines, or customer segments. The 3D visual effect intuitively conveys relative data differences, while the dual-chart layout enables side-by-side comparison of temporal changes or alternative scenarios.
-
How to Use
Replace the legend labels (A–D Company) with your actual data categories and update the percentage values to automatically refresh the charts. Customize colors to match your corporate brand guidelines, and add specific analysis titles and date ranges in the header section to provide clear context.
-
Recommended For
Marketing professionals presenting market share analysis, sales teams reporting customer preference survey results, executives reviewing business unit revenue distribution, management consultants conducting industry analysis, and educational institutions analyzing student course selection patterns.
-
Slide Structure
Each slide contains a title and subtitle area at the top, followed by two main content sections labeled 'Eye-Catching Visual 1' and 'Eye-Catching Visual 2'. Each section displays a 3D pie chart with four color-coded segments representing different items, accompanied by a legend positioned below the chart for clear data identification.
Related Products
-

City and Nature Pie Chart Statistics – Visualization of Market Status
#Market and Competitor Analysis #Graph #Market Status
-

Pie Chart of the Development Status of the Snow Mountain Theme
#Product/Service Introduction #Market and Competitor Analysis #Diagram
-

Market Share of Hybrid Vehicles - Pie Chart Visualization
#Market and Competitor Analysis #Graph #Market Status
-

Yellow Marketing Pie Chart – Market Share Analysis
#Market and Competitor Analysis #Graph #Market Status
