Modern Wide PowerPoint Template Donut Chart - Visualizing Revenue Model
RJ0200050_9
- Last Update 04/13/2025
- File Size 0.1MB
- # of Slides 2
- File Format PPTX
- Slide Ratio 16:9
- Color
Keywords
- #Content-Based Slides
- #Design-Based Slides
- #Product/Service Introduction
- #Business Introduction
- #Diagram
- #Graph
- #Composition
- #Revenue Model
- #Cluster
- #Circles
- #Closed Cluster Diagram
- #Doughnut Chart
- #16:9
- #pie chart PowerPoint
- #donut chart slide template
- #4-segment ratio chart
- #data visualization PowerPoint
- #business chart template download
About the Product
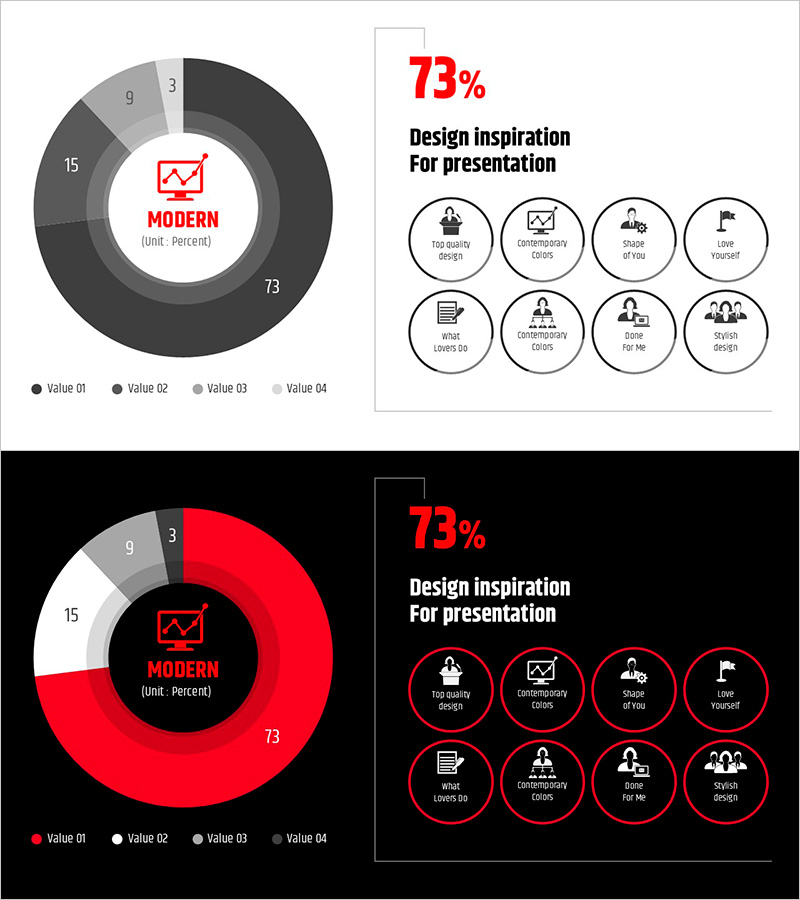
A professional pie chart PowerPoint slide that visualizes business data with four segments arranged in a circular layout. The design features a central icon area surrounded by a ring structure with gray, black, and red color accents that emphasize key metrics. This 2-slide set includes both light and dark background versions, making it adaptable to various presentation environments. Ideal for displaying revenue composition, survey results, market share, customer satisfaction metrics, and other ratio-based data analysis in business presentations, reports, and proposals.
Usage Points
-
Main Usage
Display ratio-based data through a pie chart format that allows viewers to instantly grasp proportional relationships. The central icon area accommodates brand logos or key messages, while the four outer segments clearly present individual metrics and labels for each data category.
-
How to Use
Use slide 1 with the light background for standard business presentations, reports, and proposals. Apply slide 2 with the dark background for evening presentations, online meetings, and large-screen environments. Edit each segment's color and numerical values to match your actual data and customize the layout as needed.
-
Recommended For
Perfect for financial analysis, marketing reports, executive briefings, investor presentations, and market research findings. Recommended for sales teams presenting performance metrics, product portfolio composition, customer satisfaction survey results, and any business scenario requiring persuasive quantitative data communication.
-
Slide Structure
2-slide set. Slide 1: Light background (white and gray) with red central icon and 4-segment pie chart in gray, black, and light gray tones. Slide 2: Black background with red central icon and 4-segment pie chart in red, white, and gray tones. Each segment includes numerical labels and text input areas for customization.
Related Products
-

Cost Structure and Margin Analysis Chart – Donut Slide Providing Business Insights
#Product/Service Introduction #Business Introduction #Diagram
-

Experimental Configuration Content Circle Graph
#Product/Service Introduction #Technical Approach #Diagram
-

Visualizing Genetic Research Data with a Donut Chart
#Product/Service Introduction #Market and Competitor Analysis #Diagram
-

Corporate Profit Structure Analysis Donut Chart
#Product/Service Introduction #Business Introduction #Diagram
