Corporate Profit Structure Analysis Donut Chart
RM0500008_12
- Last Update 02/22/2025
- File Size 2.7MB
- # of Slides 2
- File Format PPTX
- Slide Ratio 16:9
- Color
Keywords
- #Content-Based Slides
- #Design-Based Slides
- #Product/Service Introduction
- #Business Introduction
- #Diagram
- #Graph
- #Development Status
- #Revenue Model
- #Cluster
- #Circles
- #Closed Cluster Diagram
- #Doughnut Chart
- #16:9
- #donut chart PowerPoint slide
- #4-segment pie chart template
- #corporate profit structure visualization
- #revenue ratio presentation
- #circular chart PPT download
About the Product
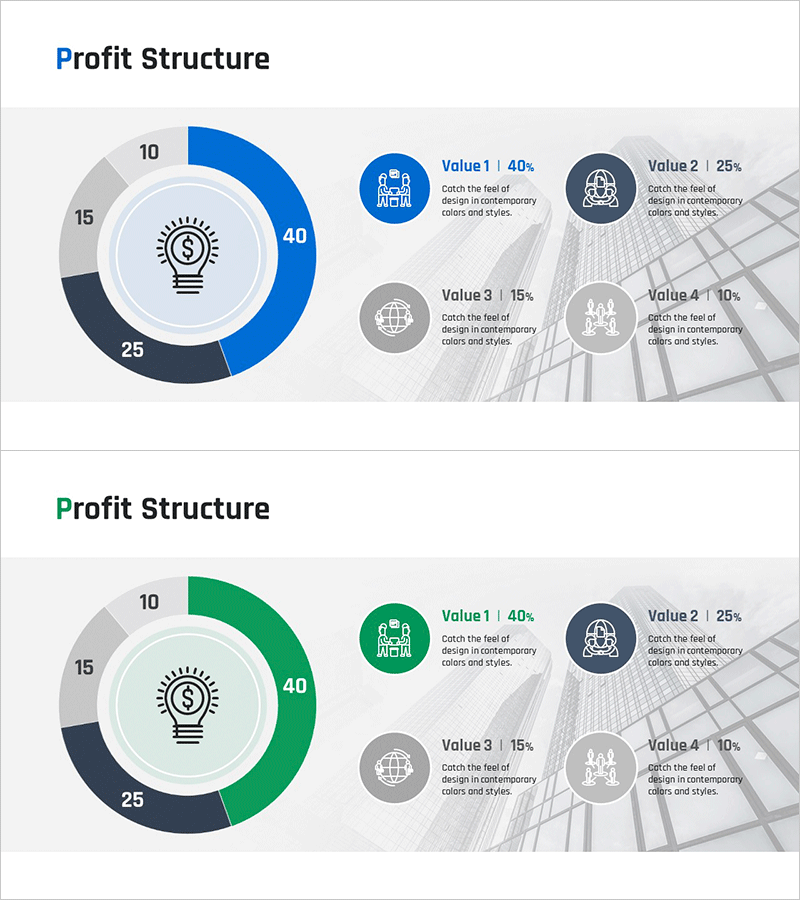
A donut chart PowerPoint slide that visualizes corporate profit structure across four segments with 40%, 25%, 15%, and 10% proportions. The design features a central lightbulb revenue icon surrounded by a multi-colored ring (blue, gray, and dark navy tones), with four labeled value items positioned on the right side. Each segment is clearly differentiated by color and paired with descriptive icons and text, making it ideal for presenting revenue models, business divisions, cost structures, and financial breakdowns. Includes two slide variations (blue and green versions) in 16:9 format, ready for immediate use in presentations, financial reports, and business plans.
Usage Points
-
Main Usage
Designed to present the proportional relationship of four key financial metrics—revenue streams, business divisions, cost allocation, or margin analysis—at a glance. The donut structure leverages the central space to highlight core messages or aggregate figures, making it ideal for financial analysis, executive reporting, and investor presentations.
-
How to Use
Edit the four donut segments with actual percentage values and corresponding labels. Customize the right-side value boxes with department names, descriptions, and icons matching your corporate branding. The central lightbulb icon can be replaced with alternative symbols (profit, growth, innovation), and the background grid pattern can be adjusted to align with company guidelines.
-
Recommended For
CFOs, financial managers, and executives presenting at shareholder meetings, board meetings, and investor briefings. Also suitable for consulting firms, accounting practices, and financial institutions preparing analytical reports, business plan revenue model sections, and marketing strategy documents with sales composition analysis.
-
Slide Structure
Left side displays a donut chart with a central lightbulb icon and four outer segments (40%, 25%, 15%, 10%) in contrasting colors. Right side contains four value items arranged in a 2×2 grid, each with an icon, title, and descriptive text. Background features an architectural grid pattern to reinforce corporate identity.
Related Products
-

Cost Structure and Margin Analysis Chart – Donut Slide Providing Business Insights
#Product/Service Introduction #Business Introduction #Diagram
-

Investment Profit Structure Donut Chart
#Product/Service Introduction #Business Introduction #Diagram
-

Automotive Technology Revenue Model Analysis Chart – Modern and Sleek Design
#Product/Service Introduction #Business Introduction #Diagram
-

Exercise Objectives Achieved Diagram & Chart – Post-Progress
#Product/Service Introduction #Business Introduction #Diagram
