PowerPoint Template – 7-Step Value Process Diagram Slide
RJ0200046_4
- Last Update 10/11/2025
- File Size 0.3MB
- # of Slides 2
- File Format PPTX
- Slide Ratio 16:9
- Color
Keywords
- #Content-Based Slides
- #Design-Based Slides
- #Operational Plan
- #Technical Approach
- #Diagram
- #Production and Technology Development Strategy
- #Service Operation Plan
- #Flow
- #Structure
- #Linear Flow
- #Tree Diagram
- #16:9
- #7-step diagram PowerPoint
- #process diagram slide template
- #value structure presentation
- #circular node diagram
- #business flow PowerPoint slide
About the Product
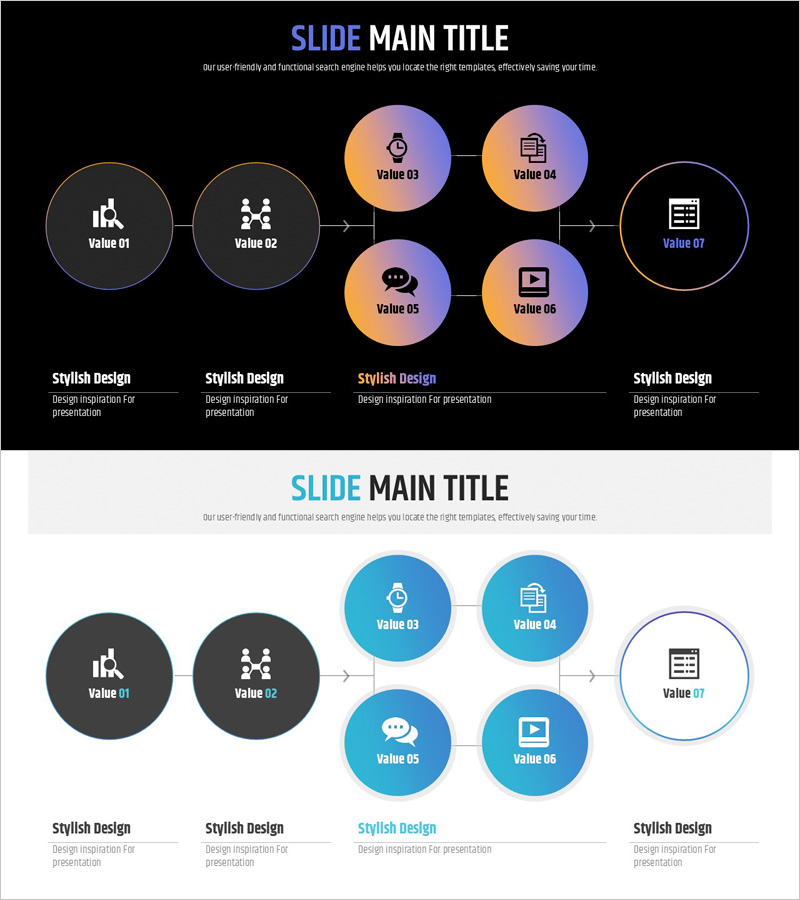
A process diagram PowerPoint slide that visualizes business value flow across 7 stages using circular nodes. The design flows from 2 input nodes on the left through 4 central value-creation nodes to 1 output node on the right, creating a clear divergence-convergence structure. Dark gray and orange-to-blue gradient color combinations distinguish each stage's importance, while icons and text labels enhance information clarity. Delivered in 16:9 widescreen format with 2 slides, ready for immediate use in strategy presentations, operational planning, and business model explanations.
Usage Points
-
Main Usage
Visualizes enterprise value creation processes, business operational flows, and strategic execution stages across 7 segments. The design guides viewers from left-side input stages through central value-creation activities to right-side output results, enabling instant comprehension of the complete process flow.
-
How to Use
Edit the text and icons within each node to match your business context. Input elements go in the 2 left nodes, core value activities in the 4 central nodes, and final outcomes in the right node. Colors and node sizes can be adjusted based on emphasis requirements.
-
Recommended For
Ideal for strategy planning teams, operations management teams, and business development teams presenting process explanations. Effective in business plans, operational planning documents, strategic reports, and business model introduction materials when explaining value flows.
-
Slide Structure
2-slide set. First slide features a dark background with 2 dark gray nodes on the left, 4 orange-to-blue gradient circular nodes in the center, and 1 outline node on the right, forming a divergence-convergence diagram. Second slide provides the same structure on a light background. All nodes include icons and text labels connected by directional arrows.
Related Products
-

Construction Equipment Infographic – Design Emphasizing Technology and Efficiency
#Product/Service Introduction #Operational Plan #Diagram
-

Flow Diagram for Galaxy Theme Product Strategy
#Operational Plan #Marketing Plan and Strategy #Diagram
-

Key Theme and Two Critical Components – Technical Service Diagram
#Technical Approach #Diagram #Service Operation Plan
-

Mapping the Flow of Key Components – Multidirectional Service Operations
#Technical Approach #Diagram #Service Operation Plan
