System Execution Flow – Efficient Service Operations Strategy
RB0800025_8
- Last Update 03/23/2025
- File Size 0.2MB
- # of Slides 2
- File Format PPTX
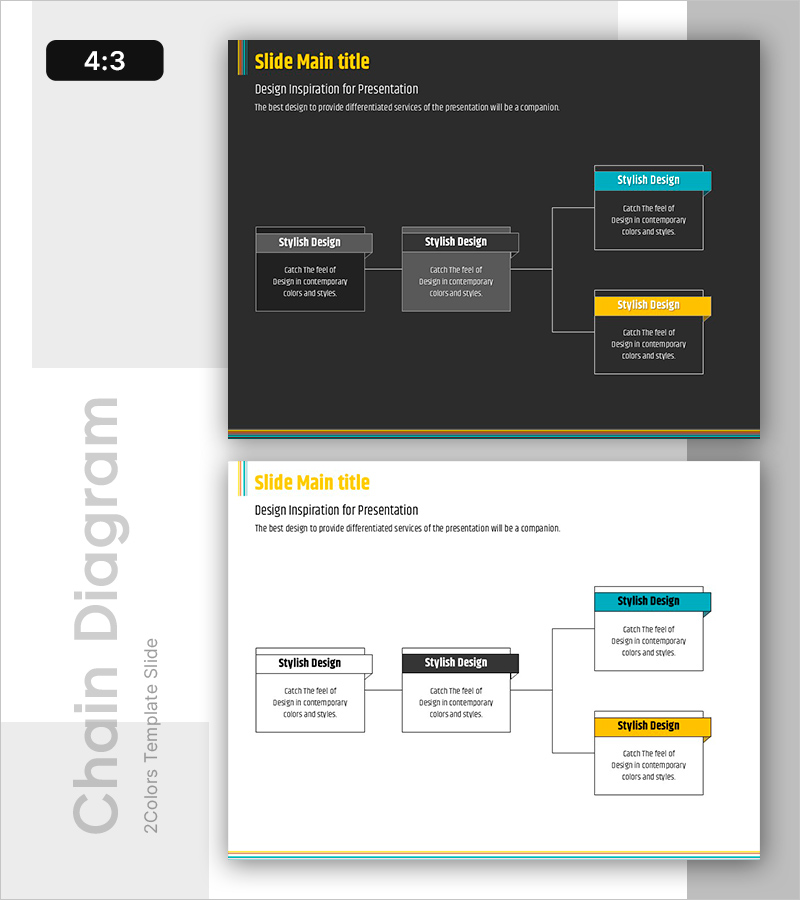
- Slide Ratio 4:3
- Color
Keywords
About the Product
A tree diagram PowerPoint slide that clearly visualizes system execution flows and hierarchical structures. Featuring a dark background with yellow and cyan accent boxes, this 2-slide presentation includes a title slide and a diagram slide. The structure expands from 2 left-side nodes to 2 right-side nodes, effectively representing decision flows, service operations, and organizational hierarchies. Each node provides editable text areas for organizational structures, technical architectures, and operational frameworks. Designed in 4:3 aspect ratio for seamless compatibility with existing presentations.
Usage Points
-
Main Usage
Ideal for expressing system execution flows, organizational hierarchies, decision-making processes, and technical architectures. The left-to-right expanding structure effectively communicates logical progression from high-level concepts to detailed components.
-
How to Use
Customize node text for technical presentations, service operations strategy, organizational structure introductions, and system architecture explanations. Color-coded accent boxes highlight key items, while connecting arrows clarify relationships between hierarchical levels.
-
Recommended For
IT technical teams, operations management departments, strategic planning teams, organizational restructuring presentations, and system implementation project briefings. Particularly effective for explaining complex system structures and organizational hierarchies.
-
Slide Structure
Slide 1: Title slide with yellow accent line. Slide 2: Tree diagram with 4-node structure—2 nodes on left side expanding to 2 nodes on right side. Each node features dark background text boxes with yellow and cyan accent boxes for emphasis and visual hierarchy.
Related Products
-

Visualizing the Folder Hierarchy and Structure – The Beginning of an Efficient Organization
#Technical Approach #Diagram #Service Architecture Diagram
-

Integrated Expansion Strategy Diagram – Service Operation Plan
#Technical Approach #Diagram #Service Architecture Diagram
-

Sustainable Operation System Diagram – Efficiency and Innovation
#Technical Approach #Diagram #Service Architecture Diagram
-

Smart Logistics Network Impact – Innovative Service Operation Strategy
#Technical Approach #Diagram #Service Architecture Diagram
