Linear Diagram for Research and Development – Process Visualization
RJ0400006_12
- Last Update 05/18/2025
- File Size 1MB
- # of Slides 2
- File Format PPTX
- Slide Ratio 16:9
- Color
Keywords
- #Content-Based Slides
- #Design-Based Slides
- #Operational Plan
- #Technical Approach
- #Diagram
- #Production and Technology Development Strategy
- #Research and Development
- #Flow
- #Linear Flow
- #16:9
- #linear diagram PowerPoint
- #arrow diagram slide template
- #3-stage process flow
- #research development PPT template
- #how to create process flow diagram in PowerPoint
About the Product
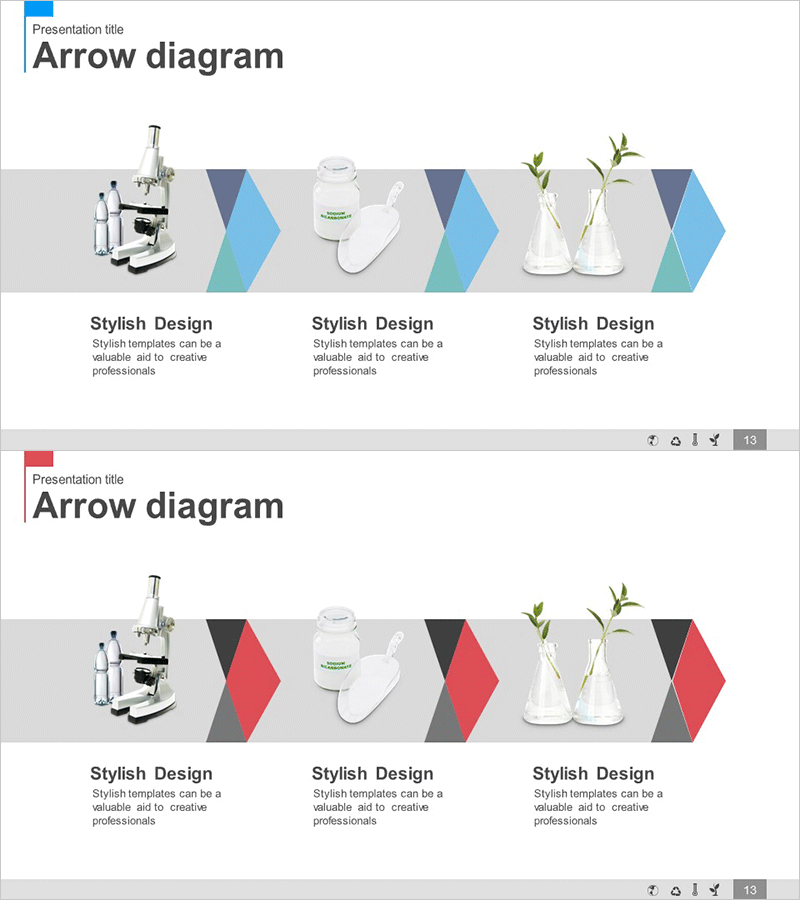
A 3-stage linear arrow diagram PowerPoint slide designed to visualize research and development processes step by step. The slide features a light gray background with alternating blue and pink arrow shapes, each with dedicated image insertion areas for product photos (microscope, container, plant). Optimized for 16:9 widescreen format across 2 slides. Ready to use for technology presentations, operational planning, and project progress reports.
Usage Points
-
Main Usage
Clearly communicate sequential research, technology development, and operational processes using a left-to-right linear flow structure. Combines stage descriptions with product images and visual elements to enhance audience comprehension and engagement.
-
How to Use
Enter stage names (planning, development, validation) into each arrow section. Insert relevant process photos or product images into the designated image areas. Add detailed explanations in text boxes to guide the audience's attention naturally from left to right through the process.
-
Recommended For
Technology leaders, R&D managers, project managers, and CTOs presenting development processes to executives and investors. Ideal for new product launch presentations, technology innovation reports, and research achievement briefings.
-
Slide Structure
2-slide set with 3 arrow nodes per slide (blue-pink-blue sequence from left to right). Each node includes an image insertion area and text description field. Arrows clearly indicate forward progression direction.
Related Products
-

Future Technology Plans and Strategies – Innovation and Technological Advancement
#Operational Plan #Technical Approach #Diagram
-

Maple Leaf Arrow Future Plans Slide
#Operational Plan #Technical Approach #Diagram
-

Extreme Sports Jumping Diagram – Dynamic Flow and Structure
#Operational Plan #Diagram #Production and Technology Development Strategy
-

Detailed Architectural Design Steps – Flow with Modern Touch
#Product/Service Introduction #Business Strategy #Operational Plan
