Business Forest Wide Template Column Chart
RJ0200026_5
- Last Update 04/04/2025
- File Size 1.8MB
- # of Slides 2
- File Format PPTX
- Slide Ratio 16:9
- Color
Keywords
About the Product
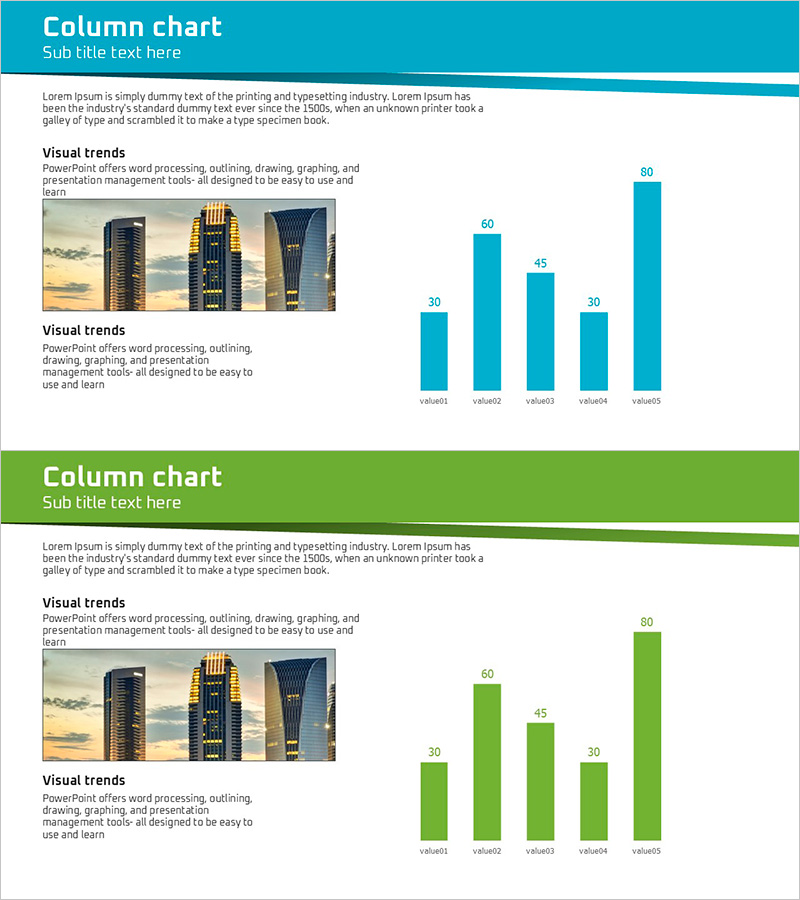
A professional vertical column chart PowerPoint slide set featuring 2 slides in teal and green color schemes for comparing 5 data items. Each slide includes an architectural imagery section paired with a clearly labeled bar chart displaying values of 30, 60, 45, 30, and 80. The layout balances descriptive text on the left with the chart visualization on the right, optimized for 16:9 widescreen format. Ideal for business presentations requiring straightforward numerical comparisons and data-driven storytelling.
Usage Points
-
Main Usage
Displays comparative analysis of 5 data points using vertical bars, making relative values immediately visible. Commonly used for quarterly sales comparisons, departmental performance metrics, product revenue analysis, and year-over-year growth tracking in executive presentations.
-
How to Use
Replace the title text with your analysis topic and update the chart values and labels with your actual data. The teal version conveys stability and trust, while the green version emphasizes growth and positive momentum. Both versions maintain professional appearance across different presentation contexts.
-
Recommended For
Financial reports, quarterly business reviews, marketing performance dashboards, sales team presentations, and management briefings. Suitable for finance teams, business analysts, and executives presenting data-driven insights requiring clear numerical comparisons.
-
Slide Structure
Two-slide set with consistent layout: title area at top, descriptive text section on left, and 5-bar vertical column chart on right. Bars represent values 30, 60, 45, 30, and 80 with numerical labels above each column for easy reference.
Related Products
-

Identity Presentation Wide Company Overview – Rich Information Delivery
#Company Introduction #Graph #Company Overview
-

Company Current Status Overview Slide – Key Metrics at a Glance
#Company Introduction #Text Box #Company Overview
-

Presentation Slide Visualizing Company Performance with Column Chart
#Company Introduction #Market and Competitor Analysis #Diagram
-

Key Performance Analysis Vertical Bar Chart – Emphasizing Analysis and Growth
#Company Introduction #Market and Competitor Analysis #Graph
