Column Chart for Market and Competitor Analysis – Modern Business Strategy
RJ0200028_25
- Last Update 04/05/2025
- File Size 6.8MB
- # of Slides 3
- File Format PPTX
- Slide Ratio 16:9
- Color
Keywords
- #Content-Based Slides
- #Design-Based Slides
- #Business Strategy
- #Market and Competitor Analysis
- #Graph
- #Financial Outlook & Expected Impact
- #Future Outlook
- #Column
- #Column Chart
- #16:9
- #column chart PowerPoint
- #market analysis slides
- #competitor comparison template
- #data visualization chart
- #business strategy presentation
About the Product
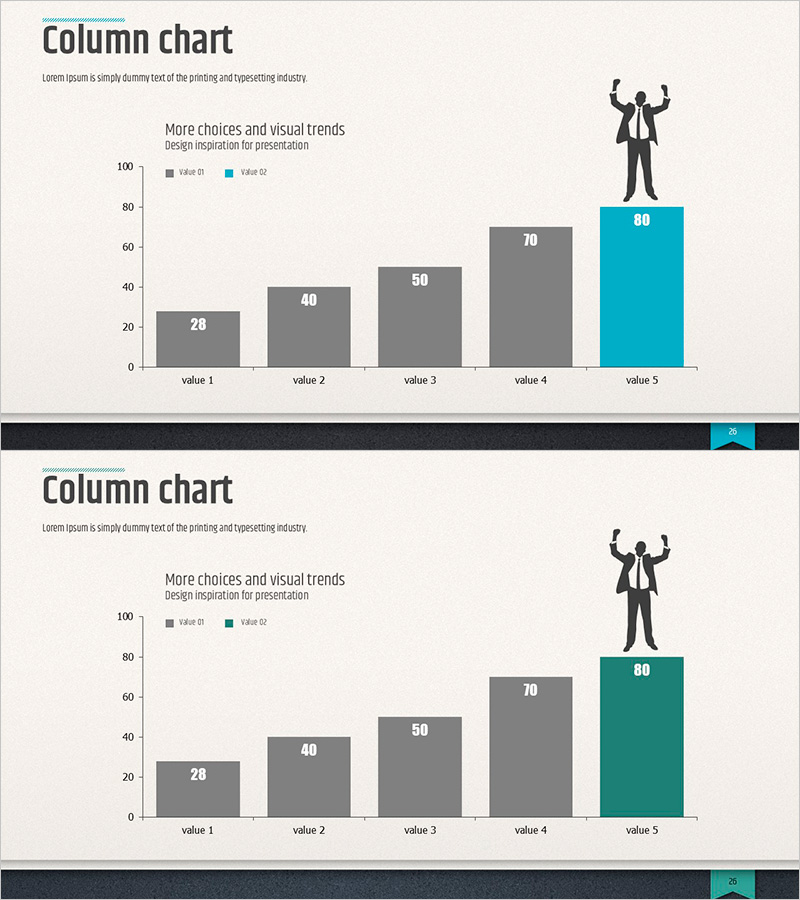
A vertical column chart PowerPoint slide designed for market analysis and competitor comparison across five data points. The design features a two-tone color scheme combining gray and teal bars to clearly distinguish between data series, with numerical values displayed directly on each column for enhanced clarity. This presentation template is ready to use for business strategy presentations, market status reports, and competitive analysis documents. The 16:9 widescreen format with three slide variations allows flexible customization for different presentation scenarios.
Usage Points
-
Main Usage
Compares numerical data such as market size, sales volume, and market share across five categories to visualize competitive positioning at a glance. Serves as a foundation for business strategy development and clearly communicates market position to investors and stakeholders.
-
How to Use
Simply replace the bar heights and numerical values with your own data. Update the legend labels (Value 01, Value 02) to match your actual metrics, and adjust the background and bar colors to align with your company branding for a polished analysis presentation.
-
Recommended For
Ideal for executives, marketing teams, sales departments, and business development teams presenting market status reports, competitive analysis, and business proposals. Effective for quarterly performance reviews, new business pitches, and investor relations presentations.
-
Slide Structure
Three-slide set featuring a dual-series five-step column chart on the first slide, a single-series variant on the second, and a color-modified version on the third. Each slide includes a Y-axis scale (0-100), legend, and title area in 16:9 widescreen format for seamless integration into presentations.
Related Products
-

Elevation Graph Above Sofa Image - Visualizing Business Growth
#Business Strategy #Market and Competitor Analysis #Graph
-

Analysis and Graphs in Future Prediction – Market Strategy and Profitability
#Business Strategy #Market and Competitor Analysis #Diagram
-

Donation Participation Rate Graph – Business Strategy and Future Outlook
#Business Strategy #Market and Competitor Analysis #Graph
-

Technology Service Future Outlook and Expected Effect – High-Quality Graph Design
#Business Strategy #Market and Competitor Analysis #Graph
