Visualizing Successful Business Performance with Horizontal Bar Chart
RJ0900004_6
- Last Update 08/16/2025
- File Size 1.7MB
- # of Slides 2
- File Format PPTX
- Slide Ratio 16:9
- Color
Keywords
- #Content-Based Slides
- #Design-Based Slides
- #Company Introduction
- #Business Strategy
- #Graph
- #Key Achievements
- #Achievements
- #Column
- #Column Chart
- #16:9
- #horizontal bar chart PowerPoint
- #business performance slide template
- #data visualization PPT
- #bar graph presentation
- #how to create bar chart in PowerPoint
About the Product
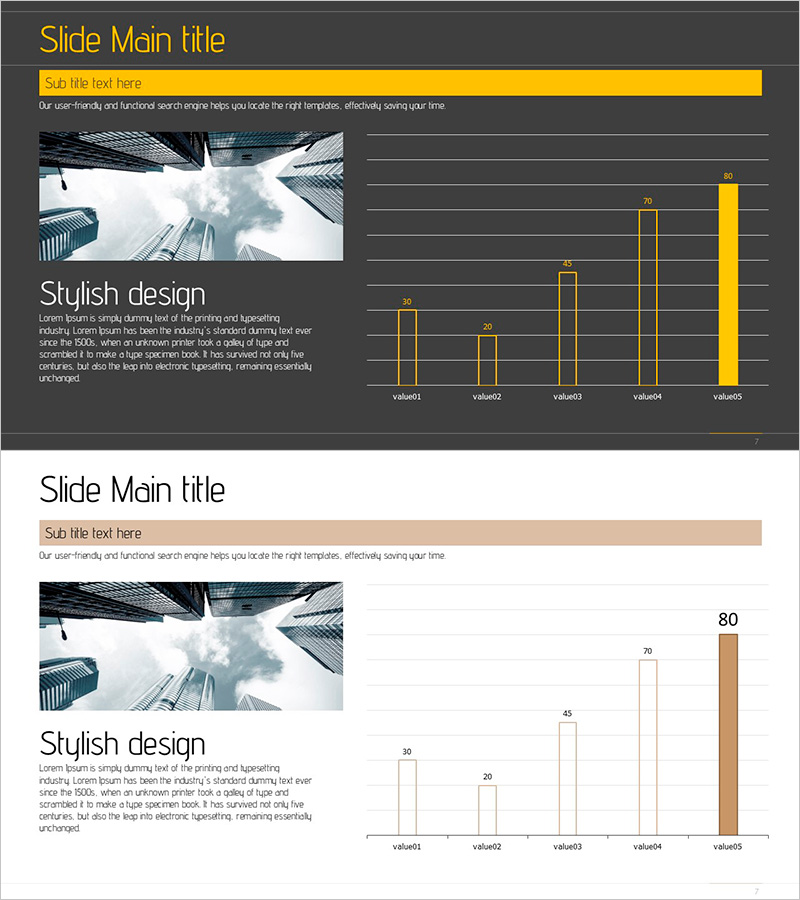
A professional horizontal bar chart PowerPoint slide designed to visualize business performance metrics across five categories. This presentation template features two distinct layouts: one with a dark gray background and yellow accent bars, and another with a white background and beige accent bars. Each layout clearly displays comparative data points with labeled values, making it ideal for quarterly reports, departmental performance reviews, and executive presentations. The 16:9 widescreen PPTX format allows instant customization—simply replace the category names and numerical values to match your data, and the bars automatically adjust proportionally.
Usage Points
-
Main Usage
This slide template enables side-by-side comparison of quantitative metrics across five categories, making it perfect for displaying sales figures, departmental performance, regional results, or any ranked data. The horizontal bar layout allows viewers to quickly assess relative values and identify top performers or areas needing attention.
-
How to Use
Replace the default category labels (value1–value5) and numerical values with your actual data. The bar lengths automatically scale to match the values you input. You can freely adjust colors, fonts, and background to match your corporate branding. Choose between the dark gray or white background version depending on your presentation context.
-
Recommended For
Finance teams presenting quarterly earnings or budget allocations, sales departments comparing regional or product performance, operations teams analyzing departmental efficiency metrics, executive leadership reviewing KPIs, and business plan presentations showing target versus actual results.
-
Slide Structure
Two-slide set with identical structure but different color schemes. Each slide features five horizontal bars representing five data categories, with numerical labels aligned to the right. Includes title area, subtitle area, and legend space. 16:9 aspect ratio, fully editable PPTX format.
Related Products
-

Blue Orange Vertical Bar Chart – Emphasizing Creativity
#Company Introduction #Business Strategy #Graph
-

Vertical Bar Graph Flow – Market and Performance Analysis
#Business Strategy #Market and Competitor Analysis #Graph
-

Check Pattern Template for Subject Performance Visualization
#Company Introduction #Product/Service Introduction #Graph
-

Visual Slide for Pet Store Growth Achievements
#Company Introduction #Business Strategy #Diagram
