Vertical Bar Segmentation Graph – Business Performance and Revenue Outlook
RJ0200041_11
- Last Update 04/09/2025
- File Size 0.2MB
- # of Slides 2
- File Format PPTX
- Slide Ratio 16:9
- Color
Keywords
- #Content-Based Slides
- #Design-Based Slides
- #Company Introduction
- #Business Strategy
- #Graph
- #Key Achievements
- #Financial Outlook & Expected Impact
- #Column
- #Segmented Column
- #16:9
- #vertical bar chart PowerPoint
- #stacked bar graph slide
- #segmented chart template
- #business performance comparison
- #revenue analysis slide
About the Product
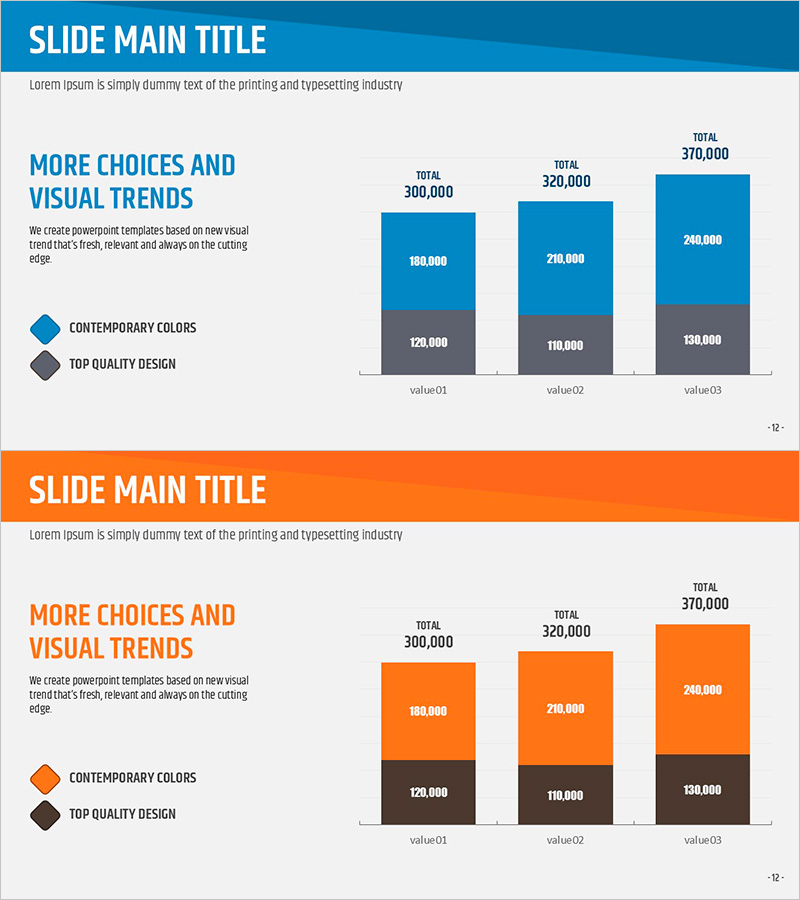
A vertical bar segmentation chart PowerPoint slide that clearly presents business performance and revenue outlook. This slide visualizes three data series stacked vertically to show both total scale and compositional ratio simultaneously. The contrast between blue and gray segments distinguishes primary and secondary metrics, with total values displayed above each bar for easy comparison analysis. Composed of 2 slides optimized for 16:9 widescreen format. Ready to use in presentations, business reports, and performance analysis documents.
Usage Points
-
Main Usage
Designed to compare quarterly or annual revenue composition, departmental performance metrics, and product-line profitability across multiple data series. Simultaneously conveys overall scale changes and individual series contribution for strategic decision-making.
-
How to Use
Use in executive briefings, quarterly earnings presentations, and business planning sessions as a performance analysis slide. Color-coded segments and bar heights enable audiences to intuitively grasp data hierarchy and trends.
-
Recommended For
Finance teams, sales departments, business planning units, and consulting firms requiring quantitative performance analysis. Suitable for business plans, quarterly reports, and investor presentations.
-
Slide Structure
2-slide set. Each slide displays 3 vertical bars with 3 data series (blue, gray, and accent color) stacked per bar. Total values are labeled above each bar. Legend and title areas are clearly positioned for readability.
Related Products
-

Internet Business Analysis Graph - Powerful Data Visualization
#Company Introduction #Business Strategy #Graph
-

Travel Business Trends and Future Prospects - Strategies for Revenue Growth
#Business Introduction #Business Strategy #Graph
-

Graph of Future Development of Calligraphy – Revenue Projections and Expectations
#Business Strategy #Technical Approach #Graph
-

Competitor Analysis Vertical Bar Segmentation Graph
#Company Introduction #Market and Competitor Analysis #Graph
