Profitability Outlook Breakdown Graph – Future Predictions and Strategies
RJ0300011_13
- Last Update 04/21/2025
- File Size 0.4MB
- # of Slides 2
- File Format PPTX
- Slide Ratio 16:9
- Color
Keywords
- #Content-Based Slides
- #Design-Based Slides
- #Business Strategy
- #Market and Competitor Analysis
- #Graph
- #Financial Outlook & Expected Impact
- #Market Status
- #Column
- #Segmented Column
- #16:9
- #stacked column chart PowerPoint
- #revenue breakdown graph
- #business strategy slide
- #financial analysis presentation
- #3-series chart template
- #profitability forecast slide
About the Product
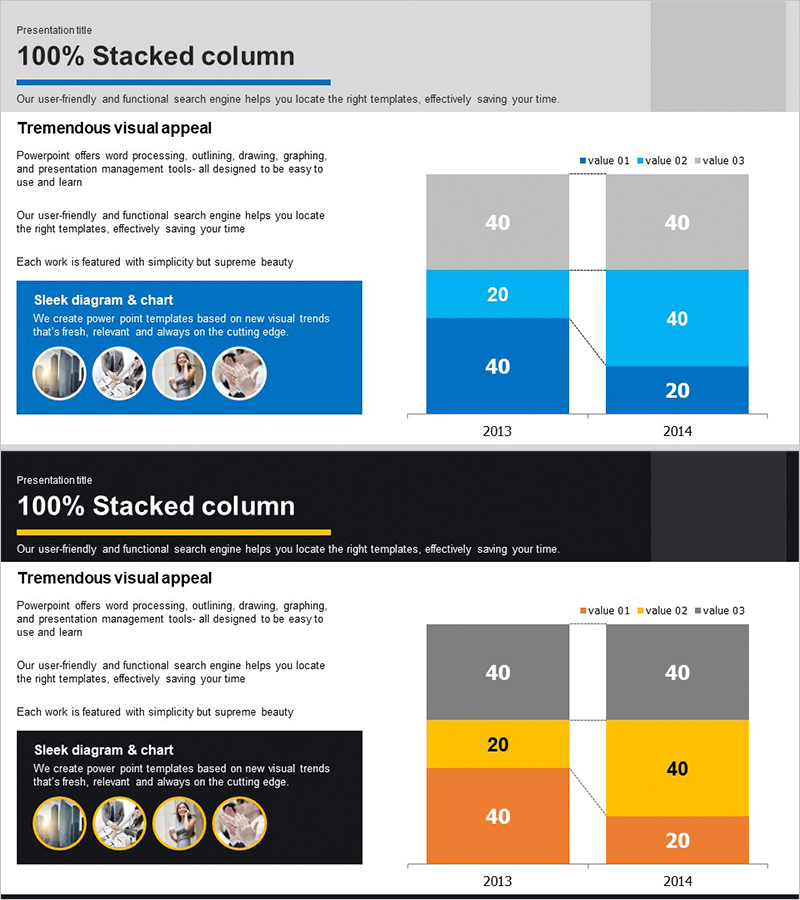
A 100% stacked column chart PowerPoint slide comparing revenue forecasts for 2013 and 2030 across three data series. The chart uses blue, orange, and gray color gradients to distinguish each series, with clear numerical labels for each segment. Ideal for visualizing profitability analysis during business strategy presentations, financial forecasting, and market analysis reports. The slide deck is provided in 16:9 PPTX format with fully editable colors, values, and labels for seamless integration into investor pitches and executive presentations.
Usage Points
-
Main Usage
Compares revenue scale across years and data series while visualizing future projections. Used in business strategy development to clearly communicate profitability analysis results to executives and investors. Serves as a key chart in financial forecasting and market analysis sections of presentations.
-
How to Use
Edit the displayed values and colors to match your data. Change years, series names, and revenue figures to adapt the chart to various comparison scenarios. Insert into business plans, investor pitch decks, and management reports to present revenue trends and strategic impact with visual clarity.
-
Recommended For
CFOs, financial analysts, executives, and business development teams presenting revenue analysis results. Suitable for startup investment pitches, quarterly and annual corporate reports, consulting firm strategy proposals, and presentations demonstrating revenue improvement strategies.
-
Slide Structure
Two-slide layout. First slide features a blue background explanation section. Second slide displays a 100% stacked column chart with 2013 and 2030 data divided into three series (value 01, value 02, value 03). Each column segment shows values like 40, 20, 40, with dotted arrows highlighting year-over-year changes.
Related Products
-

Origami Presentation Template Section Vertical Bar Graph – Strategic Business Drive
#Business Strategy #Market and Competitor Analysis #Graph
-

Profitability Analysis Segmentation Graph – Market Status and Strategy
#Business Strategy #Market and Competitor Analysis #Graph
-

Internet Business Analysis Graph - Powerful Data Visualization
#Company Introduction #Business Strategy #Graph
-

Horizontal Bar Chart for Skincare Market Sales Status
#Business Strategy #Financial Plans and Performance #Graph
