Simple Circle Presentation Template Segmented Vertical Bar Graph – Market Data Analysis
RJ0200013_10
- Last Update 04/01/2025
- File Size 0.8MB
- # of Slides 2
- File Format PPTX
- Slide Ratio 16:9
- Color
Keywords
- #Content-Based Slides
- #Design-Based Slides
- #Technical Approach
- #Market and Competitor Analysis
- #Graph
- #Future Development Roadmap
- #Market Status
- #Column
- #Segmented Column
- #16:9
- #vertical bar chart PowerPoint
- #bar graph presentation slide
- #market data analysis chart
- #competitive analysis graph
- #how to create bar chart in PowerPoint
About the Product
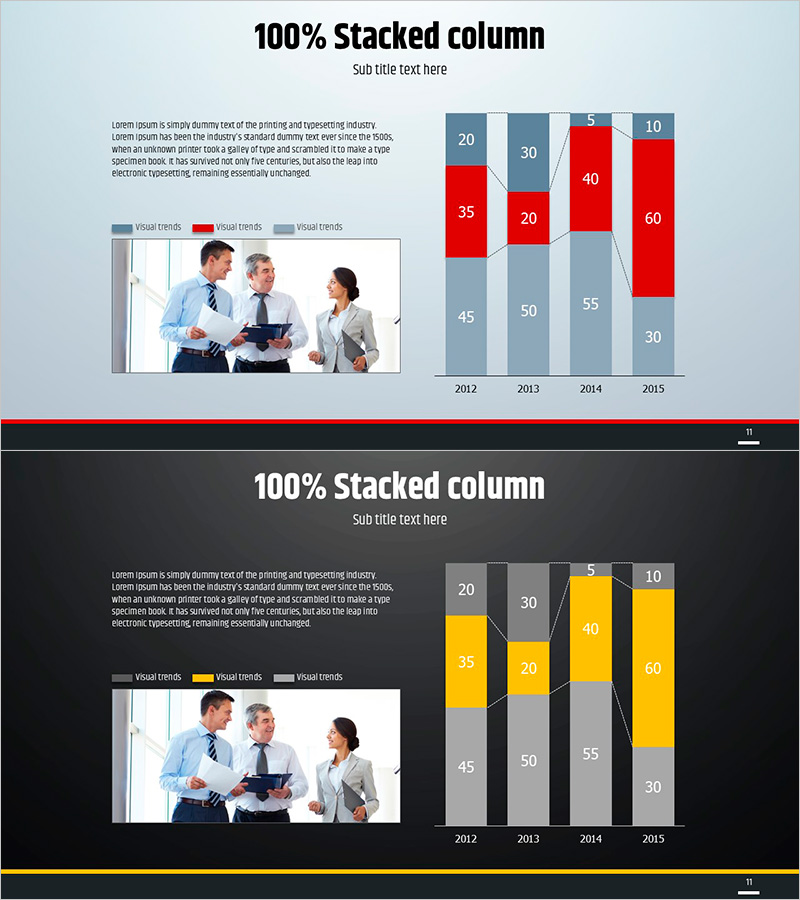
A vertical bar chart PowerPoint slide designed for market analysis and competitive benchmarking. The slide uses light blue, red, and gray color schemes to clearly differentiate four data series across 2012–2015. Each bar is labeled with precise numerical values, enabling accurate data communication in business presentations and reports. The layout supports year-over-year trend analysis and is ideal for technology sector performance reviews, market share presentations, and strategic planning discussions. Fully editable in PowerPoint for custom data input.
Usage Points
-
Main Usage
Visualizes quantitative data across four series for comparative analysis by year or business unit. Ideal for market trend analysis, competitive performance benchmarking, technology sector metrics, and financial reporting where multi-series data comparison is essential.
-
How to Use
Bar height and color differentiate data series intuitively. Numerical labels on each bar provide precise values, while the horizontal axis displays time periods or categories. Edit data directly in PowerPoint to automatically update the chart visualization.
-
Recommended For
Finance, marketing, and sales teams presenting quarterly or annual performance metrics. Suitable for executive briefings, investor presentations, market research reports, and strategic planning sessions requiring quantitative evidence and multi-year trend analysis.
-
Slide Structure
Two-slide set with consistent 4-series bar structure. First slide features light blue background with red and gray accent bars; second slide uses dark background with yellow highlights. Each bar displays values ranging 20–60, with four years (2012–2015) on the horizontal axis and three color-coded data series.
Related Products
-

Backpacking Traveler Trends Analysis Graph – Future of Travel Industry
#Technical Approach #Market and Competitor Analysis #Graph
-

Future Outlook Analysis Graph – Market and Technology Analysis
#Technical Approach #Market and Competitor Analysis #Graph
-

Graph of Future Development of Calligraphy – Revenue Projections and Expectations
#Business Strategy #Technical Approach #Graph
-

Battery Shape Vertical Bar Graph – Competitor Analysis
#Technical Approach #Market and Competitor Analysis #Graph
