Profitability Analysis Segmentation Graph – Market Status and Strategy
RJ0300009_13
- Last Update 04/20/2025
- File Size 0.4MB
- # of Slides 2
- File Format PPTX
- Slide Ratio 16:9
- Color
Keywords
- #Content-Based Slides
- #Design-Based Slides
- #Business Strategy
- #Market and Competitor Analysis
- #Graph
- #Financial Outlook & Expected Impact
- #Market Status
- #Column
- #Segmented Column
- #16:9
- #segmentation bar chart PowerPoint
- #stacked column chart template
- #revenue analysis slide
- #market status graph
- #business strategy presentation
- #data visualization PowerPoint
About the Product
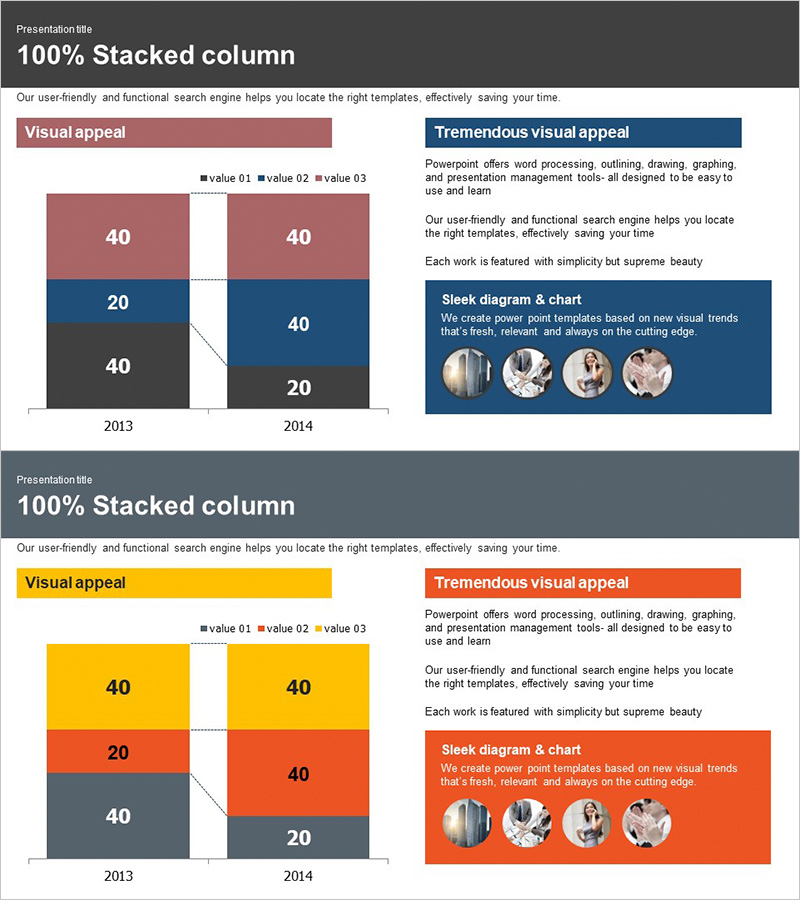
A 2-slide segmentation bar chart PowerPoint template designed for revenue analysis and market status presentations. This 100% stacked column chart visualizes data across three series (value 01, 02, 03) for years 2013 and 2014, enabling clear comparison of revenue composition changes. The design uses contrasting color schemes—yellow, orange, and gray tones—to distinguish each data series, with a legend on the left and text area on the right for insights and strategic commentary. Fully editable in PPTX format and optimized for 16:9 widescreen displays, making it ideal for business strategy presentations and financial reports.
Usage Points
-
Main Usage
Presents year-over-year revenue composition changes across three data series, enabling stakeholders to understand market dynamics and relative proportions simultaneously. The 100% stacked format shows both absolute values and relative percentages, supporting strategic decision-making in business performance analysis and planning phases.
-
How to Use
Input actual data in the left chart area, and proportions calculate automatically. Add analysis findings and strategic recommendations in the right text box. Compare 2013 and 2014 trends to highlight market shifts. Suitable for executive briefings, investor presentations, strategy meetings, and board-level discussions.
-
Recommended For
Finance and planning teams presenting revenue analysis reports, executive-level business performance reviews, investor relations presentations, marketing teams analyzing market segmentation, and consulting proposals requiring data visualization in financial or strategic sections.
-
Slide Structure
Slide 1: Title + legend (value 01, 02, 03) + 2013 and 2014 100% stacked bar charts (yellow, orange, gray series) + right-side text box. Slide 2: Identical layout with alternative color scheme (yellow, red, gray tones). Both slides feature fully editable chart data and flexible text areas for customization.
Related Products
-

Profitability Outlook Breakdown Graph – Future Predictions and Strategies
#Business Strategy #Market and Competitor Analysis #Graph
-

Origami Presentation Template Section Vertical Bar Graph – Strategic Business Drive
#Business Strategy #Market and Competitor Analysis #Graph
-

Blue Pink Market Analysis Segmented Vertical Bar Graph
#Market and Competitor Analysis #Graph #Market Status
-

Trade Business Analysis Graph – Visualizing Market Status
#Market and Competitor Analysis #Graph #Market Status
