Core Transport Competitiveness Analysis – Intuitive Visualization with Graphs
RB0800075_9
- Last Update 03/28/2025
- File Size 0.1MB
- # of Slides 2
- File Format PPTX
- Slide Ratio 4:3
- Color
Keywords
- #Content-Based Slides
- #Design-Based Slides
- #Market and Competitor Analysis
- #Graph
- #Competitor Analysis
- #Competitive Advantage
- #Circles
- #Doughnut Chart
- #4:3
- #donut chart PowerPoint slide
- #pie chart template
- #ratio comparison graph
- #competitive analysis chart
- #market analysis PPT template
- #two-item comparison slide
About the Product
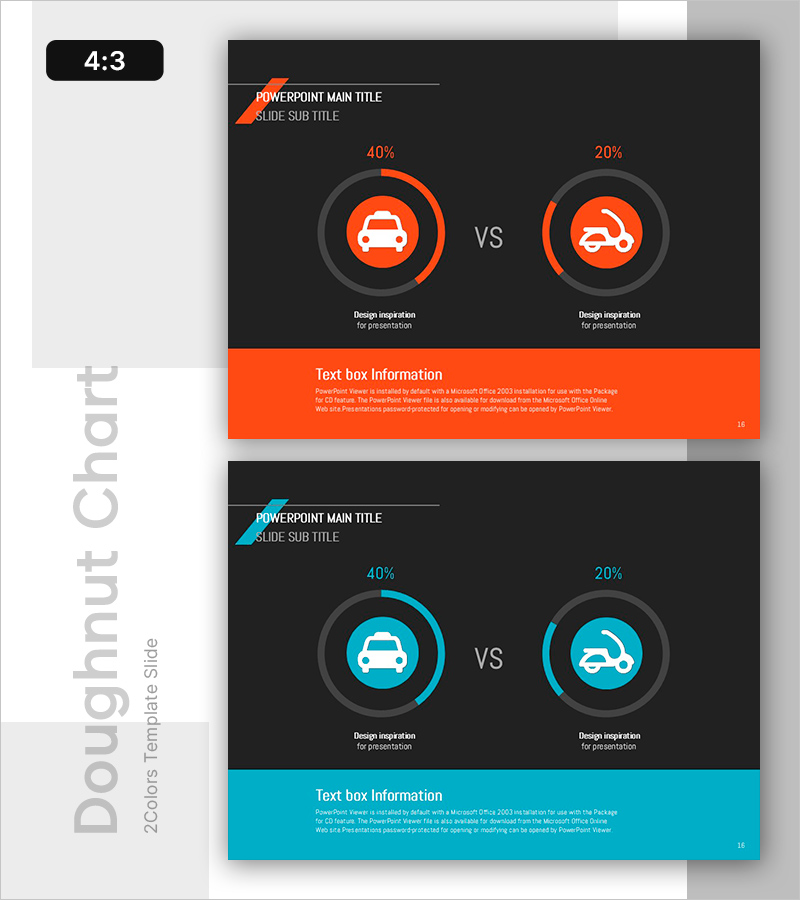
A donut chart PowerPoint slide template for comparing two transportation modes or competing products by competitiveness metrics. The design features concentric donut rings with percentage values displayed at the center, enabling intuitive visualization of market share, competitive advantage, and customer preference. Two color versions—orange and cyan—are included, each with title, subtitle, and descriptive text areas for complete presentation context. Available in 4:3 aspect ratio PPTX format, fully editable and ready for business presentations, marketing plans, strategy reports, and competitive analysis documents.
Usage Points
-
Main Usage
Designed to compare two transportation modes, products, or services by competitiveness, market share, or customer preference using percentage-based ratios. The donut ring structure emphasizes both the central numeric value and the outer ratio visualization, capturing audience attention and facilitating data-driven decision-making.
-
How to Use
Enter your analysis topic in the title and subtitle fields at the top of the slide. Update the percentage values and labels in each donut chart to match your data. Select either the orange or cyan color version to align with your corporate brand identity. Add analysis insights and conclusions in the text box at the bottom of the slide.
-
Recommended For
Marketing, strategy, and business planning professionals presenting competitive analysis, market research findings, or industry benchmarking to executives and clients. Also suitable for educational seminars and training sessions explaining industry trends and consumer behavior patterns.
-
Slide Structure
2-slide set. Slide 1 (Orange): Title + subtitle + left donut chart (40% display) + right donut chart (20% display) + center 'VS' text + orange footer text box. Slide 2 (Cyan): Identical layout with cyan color scheme. 4:3 aspect ratio, PPTX format.
Related Products
-

Global Logistics Competitor Chart
#Market and Competitor Analysis #Diagram #Graph
-

Donut Chart for Market and Competitor Analysis – Color Theme Presentation
#Market and Competitor Analysis #Graph #Competitor Analysis
-

Competitive Advantage Donut Pie Chart (3 colors) – Frontline of Market Analysis
#Market and Competitor Analysis #Graph #Competitor Analysis
-

Banking Services Sector Analysis Graph – Market and Competitor Analysis
#Market and Competitor Analysis #Graph #Competitor Analysis
