Monthly Analysis Graph of Banking Services Sector – Market and Competitor Analysis
RJ0300081_12
- Last Update 05/11/2025
- File Size 0.3MB
- # of Slides 2
- File Format PPTX
- Slide Ratio 16:9
- Color
Keywords
- #Content-Based Slides
- #Design-Based Slides
- #Market and Competitor Analysis
- #Financial Plans and Performance
- #Graph
- #Competitor Analysis
- #Market Analysis
- #Sales and Revenue
- #Column
- #Segmented Column
- #16:9
- #vertical bar chart PowerPoint
- #monthly data analysis slides
- #bar graph template
- #monthly comparison chart
- #how to create bar chart in PowerPoint
About the Product
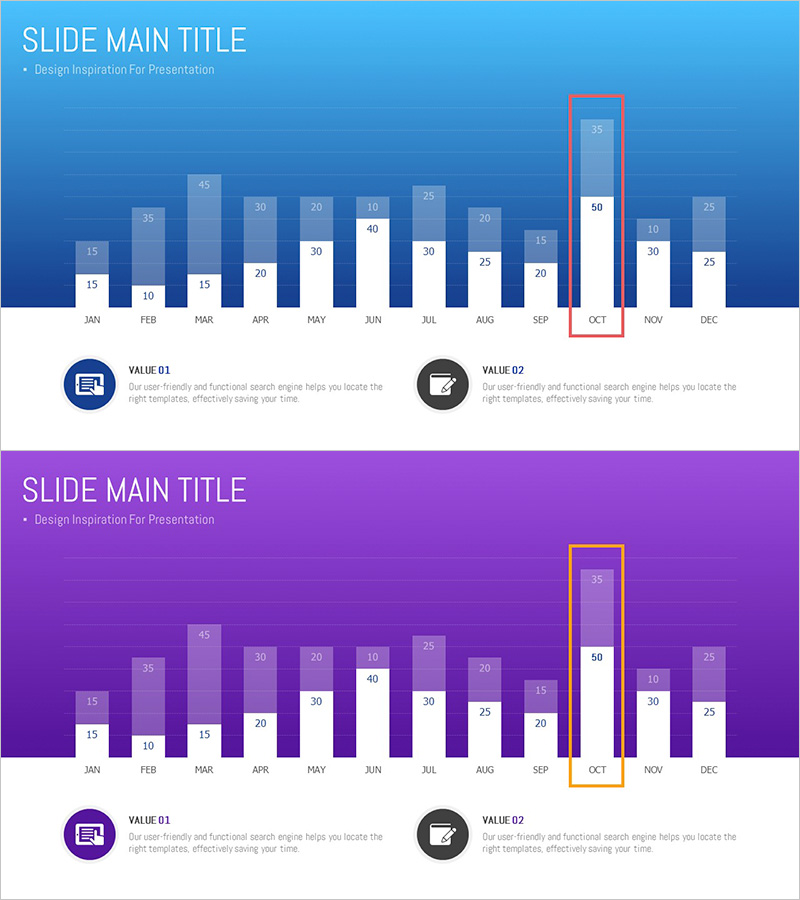
A vertical bar chart PowerPoint slide that visualizes monthly performance data in the banking services sector. The slide features a blue gradient background with 12 months (January to December) represented as vertical bars, with October highlighted in a red accent box to emphasize critical data points. Numerical values (10–50) are displayed above each bar for precise data comparison, and VALUE 01 and VALUE 02 explanation areas at the bottom allow for additional analysis commentary. The 2-slide set provides two color themes—blue and purple—so you can select the design that best matches your presentation tone.
Usage Points
-
Main Usage
This slide visualizes time-series data such as monthly revenue, sales volume, or customer count using a vertical bar chart. The highlighted October bar draws attention to key data points, while numerical values above each bar enable precise numerical comparison and trend analysis.
-
How to Use
Use this slide in monthly performance analysis, market trend reports, and competitive benchmarking presentations for banking, financial services, and insurance sectors. Add analysis results and insights in the VALUE 01 and VALUE 02 sections to create data-driven decision-making materials.
-
Recommended For
Ideal for financial institution employees and executives, marketing and sales teams presenting monthly performance, investor-facing market analysis reports, and consulting firms creating industry analysis materials. Suitable for any business presentation requiring data-driven decision support.
-
Slide Structure
The 2-slide set includes one blue-themed and one purple-themed slide. Each slide contains a 12-month vertical bar chart with October highlighted, numerical value labels, and VALUE 01 and VALUE 02 explanation areas. Optimized for 16:9 widescreen format.
Related Products
-

Business Analysis Segmented Vertical Bar Graph – Optimized for Market and Competitor Analysis
#Market and Competitor Analysis #Graph #Competitor Analysis
-

Subdivided Bar Graph for Visual Market Analysis – Presenting Competitive Data Effectively
#Market and Competitor Analysis #Diagram #Graph
-

Visualizing Bar Graphs with PC Mockups – Competitive Market Analysis Tool
#Market and Competitor Analysis #Graph #Other
-

Analysis of Courier Brand Usage Status – Insights on Competitors
#Market and Competitor Analysis #Graph #Competitor Analysis
