Triangle Pattern Column Chart Presentation Template
RJ0200016_7
- Last Update 04/02/2025
- File Size 6.2MB
- # of Slides 2
- File Format PPTX
- Slide Ratio 16:9
- Color
Keywords
- #Content-Based Slides
- #Design-Based Slides
- #Market and Competitor Analysis
- #Financial Plans and Performance
- #Diagram
- #Graph
- #Competitor Analysis
- #Sales and Revenue
- #Table
- #Column
- #Standard Table
- #Grouped Column
- #16:9
- #grouped column chart PowerPoint
- #bar graph slide template
- #4-series data comparison
- #year-over-year trend chart
- #business data visualization
About the Product
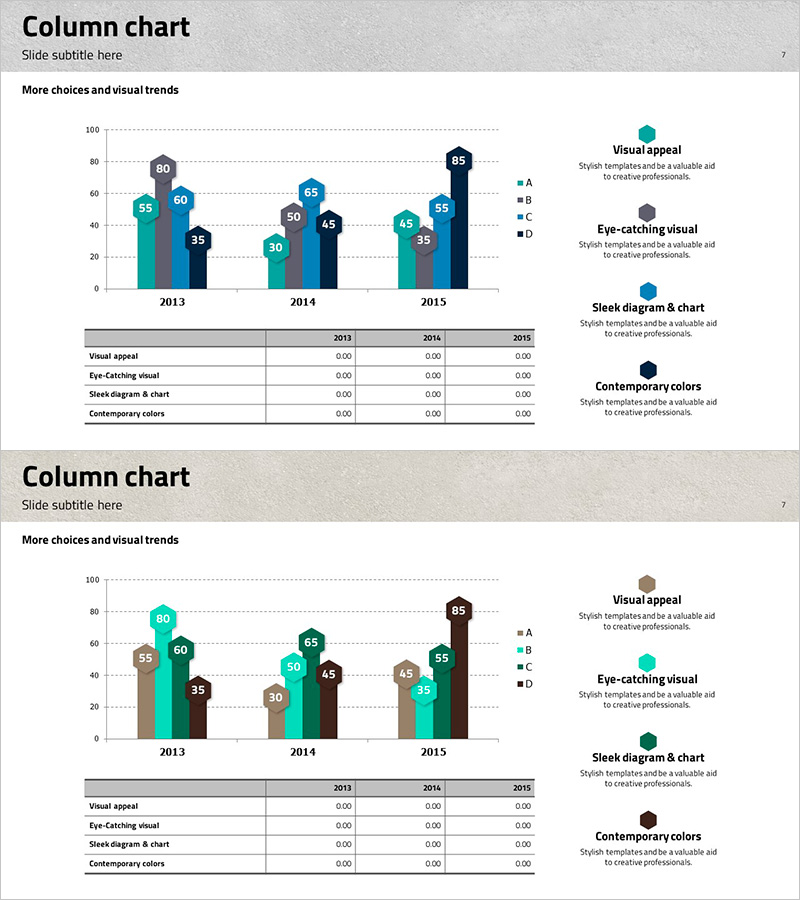
A grouped column chart PowerPoint slide comparing data across four series (A, B, C, D) from 2013 to 2015. The slide features teal, gray, and navy blue bars that clearly visualize year-over-year changes, with a legend and description area positioned on the right side for enhanced readability. This layout is ideal for executive reports, market analysis presentations, and financial planning discussions where multi-series data comparison is essential.
Usage Points
-
Main Usage
Visualize and compare numerical data across multiple series and time periods. Enables quick identification of trends, performance variations, and comparative insights across departments, regions, products, or business metrics in executive presentations.
-
How to Use
Input your data values for each year (2013, 2014, 2015) and series (A, B, C, D) into the chart. Replace the legend labels with your actual category names (product names, regions, departments, etc.). Adjust colors as needed to match your brand guidelines or presentation theme.
-
Recommended For
Finance teams, marketing departments, executive report presenters, quarterly performance reviews, market research presentations, budget allocation comparisons, sales trend analysis by region or product line, and any business presentation requiring multi-dimensional data comparison.
-
Slide Structure
Title area at top, grouped column chart in center (3 years × 4 series = 12 bars), legend box on right (color-coded A, B, C, D), description text area below legend (4 feature callouts), and data input table at bottom (year and series value fields).
Related Products
-

Botanic Garden Management Bundled Graph – Market and Performance Analysis
#Market and Competitor Analysis #Financial Plans and Performance #Graph
-

Eco-friendly Icon Bar Graph Slide
#Market and Competitor Analysis #Diagram #Graph
-

3D Printing Market Analysis Graph
#Market and Competitor Analysis #Diagram #Graph
-

Sensuous Cloud Presentation Template – Market Analysis and Financial Performance
#Market and Competitor Analysis #Financial Plans and Performance #Graph
