Bar Graph Analysis for Business Strategy – Market Diagnosis
RJ0200046_22
- Last Update 04/11/2025
- File Size 0.3MB
- # of Slides 2
- File Format PPTX
- Slide Ratio 16:9
- Color
Keywords
- #Content-Based Slides
- #Design-Based Slides
- #Business Strategy
- #Market and Competitor Analysis
- #Graph
- #Market Status
- #Horizontal Bar
- #Segmented Horizontal Bar
- #Project Progress
- #16:9
- #horizontal bar chart PowerPoint
- #bar graph slide template
- #business strategy analysis
- #market trend comparison
- #competitive analysis presentation
About the Product
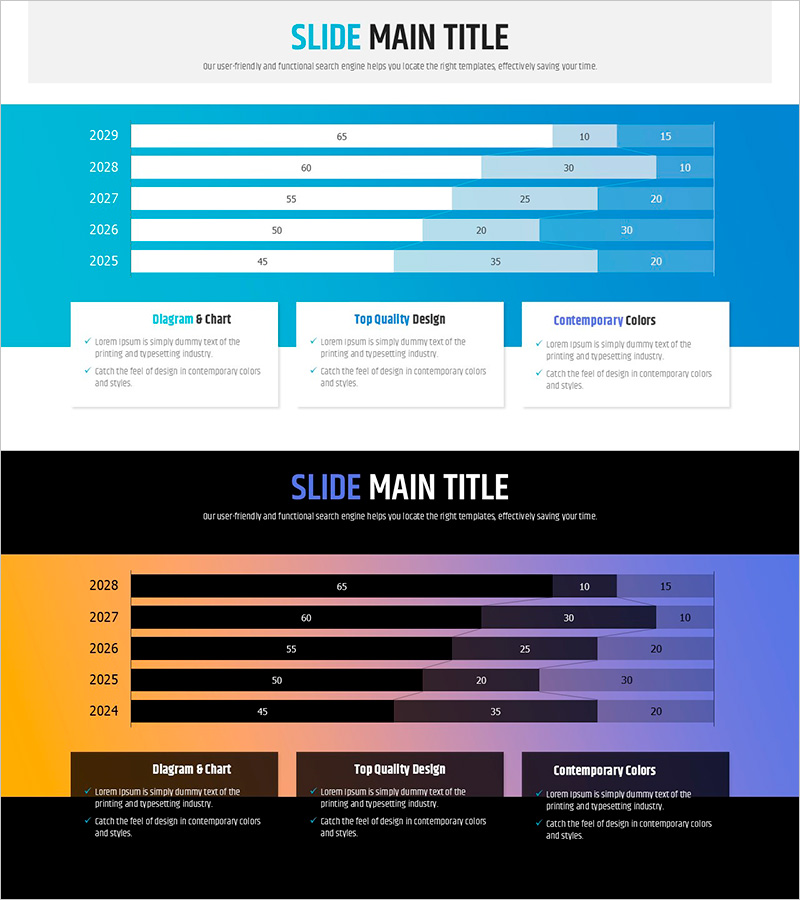
A horizontal bar chart PowerPoint slide designed to compare business progress and market trends across five years with three data series. The teal gradient background provides a professional backdrop for year-by-year bar visualization, with clear numerical labels for each data point. The slide includes three information boxes at the bottom to highlight key insights such as market diagnosis, competitive analysis, and strategic direction. This presentation template is ideal for executive reports, investor presentations, business strategy discussions, and market analysis briefings where quantitative trend comparison is essential.
Usage Points
-
Main Usage
Visualize year-over-year business performance, market size evolution, and competitor revenue trends using three horizontal bar series across five years. This data-driven slide enables stakeholders to quickly identify growth patterns, market shifts, and competitive positioning for strategic decision-making.
-
How to Use
Input actual numerical values into each year row, and the bar lengths automatically adjust proportionally. Customize the three information boxes below the chart with key messages such as 'Market Diagnosis', 'Competitive Analysis', or 'Strategic Direction' to reinforce data interpretation. Colors are fully editable to match corporate branding guidelines.
-
Recommended For
Executives, business planners, marketing managers, financial analysts, and consultants presenting business performance reports, market analysis, and competitive strategy. Particularly suited for quarterly business reviews, board meetings, investor relations presentations, and strategic planning sessions where credible data visualization is critical.
-
Slide Structure
Two-slide set featuring a horizontal bar chart with five year labels (2029–2025), three data series (15 total data points), and three customizable information boxes below. The second slide provides a color variant with orange-to-purple gradient background. Both slides are optimized for 16:9 widescreen format for modern presentation environments.
Related Products
-

Horizontal Bar Segmentation Graph – Visualizing Business Strategy
#Business Strategy #Market and Competitor Analysis #Graph
-

Bar Chart for Market Analysis Visualization – Innovation and Growth
#Business Strategy #Market and Competitor Analysis #Graph
-

Modern Wide PowerPoint Template Area Chart
#Business Strategy #Market and Competitor Analysis #Graph
-

Market Status and Trend Graph – Harmony of Blue and Orange
#Market and Competitor Analysis #Graph #Market Status
