Eco-friendly Subdivision Horizontal Bar Graph – Introduction to Market Status and Social Responsibility
RJ0600022_6
- Last Update 06/26/2025
- File Size 0.8MB
- # of Slides 2
- File Format PPTX
- Slide Ratio 16:9
- Color
Keywords
- #Content-Based Slides
- #Design-Based Slides
- #Market and Competitor Analysis
- #Corporate Social Responsibility
- #Graph
- #Market Status
- #Environmental Protection Efforts
- #Horizontal Bar
- #Segmented Horizontal Bar
- #16:9
- #100% stacked horizontal bar chart
- #stacked bar graph PowerPoint
- #ratio comparison slide template
- #3-series data visualization
- #market analysis chart download
About the Product
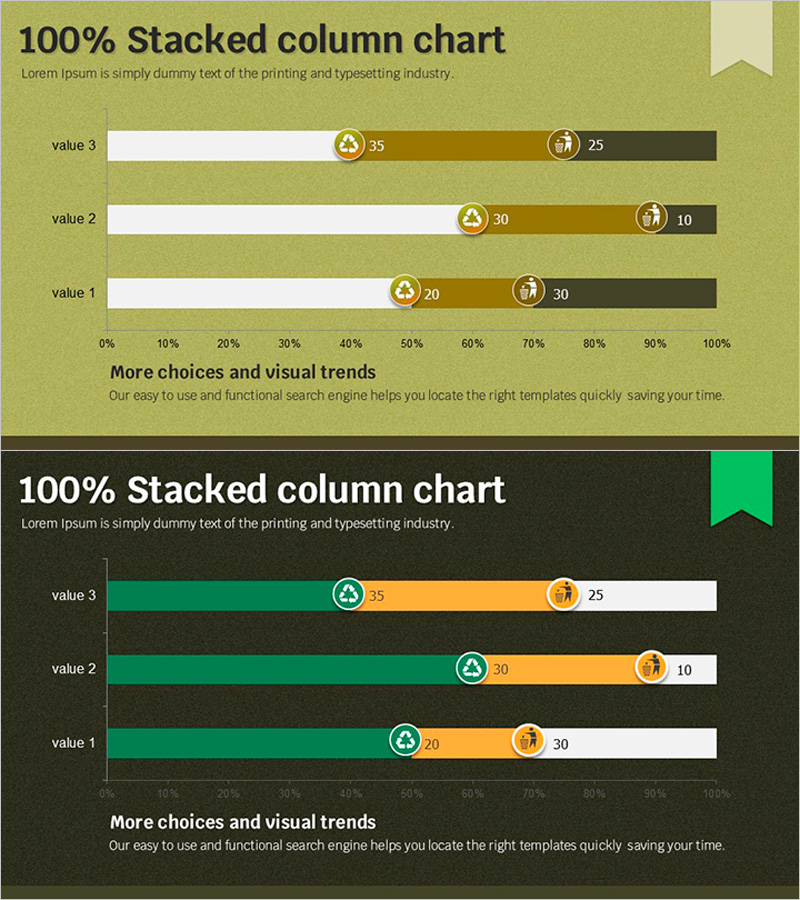
An eco-friendly themed 100% stacked horizontal bar chart PowerPoint slide featuring three data series across three categories (value 1, 2, and 3). Each series is represented with distinct colors (white, brown, dark gray) and includes icons and numerical labels for clarity. The design uses an olive green background with a dark variant option, making it ideal for market analysis, corporate social responsibility, and environmental impact presentations. This 2-slide template is ready for immediate data input and customization.
Usage Points
-
Main Usage
Compares three or more data series as proportions of a 100% whole across multiple categories. Ideal for displaying market share distribution, customer satisfaction composition, environmental impact allocation, and other part-to-whole relationships. Enables quick visual comparison of how proportions differ across categories.
-
How to Use
Enter your data values into the three category rows (value 1, 2, 3) and three series columns. The bar lengths automatically adjust to maintain 100% proportions. Icons and numerical labels update accordingly. Choose between the olive green or dark background version to match your presentation theme.
-
Recommended For
Marketing professionals, executives, consultants, and ESG/sustainability report authors. Suitable for market analysis, business performance reporting, customer segmentation analysis, environmental policy presentations, and any comparative analysis requiring proportion-based visualization.
-
Slide Structure
2-slide template with identical layouts. Each slide displays 3 categories (value 1, 2, 3) on the vertical axis with 3 stacked series (white, brown, dark gray) extending horizontally to 100%. Includes 0%-100% scale, numerical labels per series, and category icons for enhanced data readability.
Related Products
-

Bar Graph Analysis for Business Strategy – Market Diagnosis
#Business Strategy #Market and Competitor Analysis #Graph
-

Modern Wide PowerPoint Template Segmentation Horizontal Bar Chart – Market and Performance Analysis
#Business Strategy #Market and Competitor Analysis #Graph
-

Construction Status Graph – Market Analysis and Competitive Statistics
#Market and Competitor Analysis #Graph #Market Status
-

Bar Chart for Market Analysis Visualization – Innovation and Growth
#Business Strategy #Market and Competitor Analysis #Graph
