Modern Wide PowerPoint Template Segmentation Horizontal Bar Chart – Market and Performance Analysis
RJ0200050_23
- Last Update 04/12/2025
- File Size 0.1MB
- # of Slides 2
- File Format PPTX
- Slide Ratio 16:9
- Color
Keywords
- #Content-Based Slides
- #Design-Based Slides
- #Business Strategy
- #Market and Competitor Analysis
- #Graph
- #Achievements
- #Market Status
- #Horizontal Bar
- #Segmented Horizontal Bar
- #16:9
- #horizontal bar chart PowerPoint
- #segmented chart template
- #market analysis slide
- #performance comparison graph
- #3-series bar chart PPT
About the Product
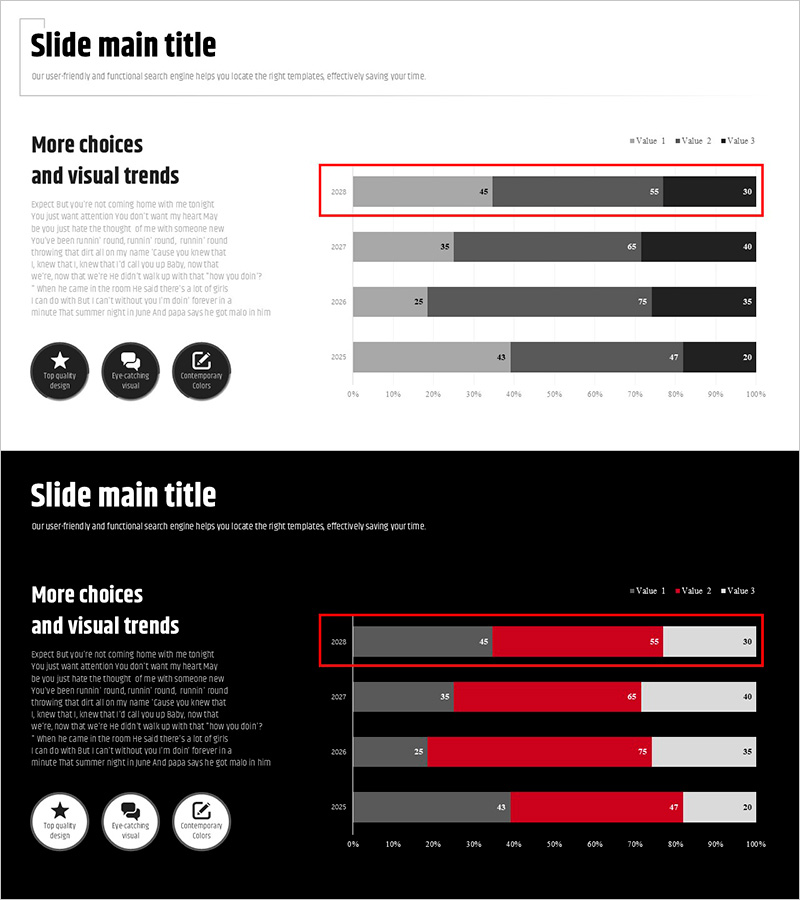
A horizontal bar chart PowerPoint slide designed for market analysis and performance comparison with three data series. The chart uses gray, red, and black colors to distinguish data categories, with a horizontal axis ranging from 0 to 100% for intuitive numerical representation. The structure enables simultaneous comparison of data across four years (2028 to 2025) for each item, making it ideal for marketing reports, business performance analysis, and market research presentations. Provided in 16:9 widescreen PPTX format with fully editable text and numerical values.
Usage Points
-
Main Usage
This horizontal bar chart slide is designed for comparing numerical data across years and categories. By using three distinct colors to represent different data series, it enables simultaneous visualization of multiple metrics such as market share, revenue trends, and performance indicators. It effectively supports data-driven decision-making in business reports, marketing plans, and investor presentations.
-
How to Use
Reference the year legend (2028, 2027, 2026, 2025) and color legend (gray, red, black) at the top of the slide to input your data values. The horizontal axis is calibrated for 0–100% range, making it suitable for percentage data or normalized values. Double-click text boxes and numerical fields to edit, and adjust colors and axis ranges as needed for your specific data.
-
Recommended For
Marketing professionals, planners, analysts, and executives use this slide when presenting market research findings, sales performance, competitive analysis, and customer satisfaction metrics. It is particularly effective when simultaneous year-over-year and item-by-item comparisons are required, such as quarterly performance reviews, strategic planning meetings, and executive briefings.
-
Slide Structure
The template consists of 2 slides, each displaying a horizontal bar chart with 4 items (2028, 2027, 2026, 2025). The first slide uses gray, black, and gray color series, while the second slide uses gray, red, and white series, allowing you to select the color scheme that best matches your data narrative. Both slides are formatted in 16:9 widescreen aspect ratio.
Related Products
-

Orange and Grapefruit Consumption Ratio – Visualized Performance Analysis
#Business Strategy #Market and Competitor Analysis #Graph
-

Horizontal Bar Segmentation Graph – Visualizing Business Strategy
#Business Strategy #Market and Competitor Analysis #Graph
-

Stacked Bar Graph for Growing Market Trends – Business Strategy
#Business Strategy #Market and Competitor Analysis #Graph
-

100% Stacked Column Chart Slide – Performance and Market Trends
#Business Strategy #Market and Competitor Analysis #Graph
