Horizontal Bar Segmentation Graph – Visualizing Business Strategy
RJ0200025_13
- Last Update 04/04/2025
- File Size 3.2MB
- # of Slides 2
- File Format PPTX
- Slide Ratio 16:9
- Color
Keywords
- #Content-Based Slides
- #Design-Based Slides
- #Business Strategy
- #Market and Competitor Analysis
- #Graph
- #Market Status
- #Horizontal Bar
- #Segmented Horizontal Bar
- #Project Progress
- #16:9
- #horizontal bar chart PowerPoint
- #stacked bar graph slide
- #cumulative bar chart template
- #business progress visualization
- #data chart download
About the Product
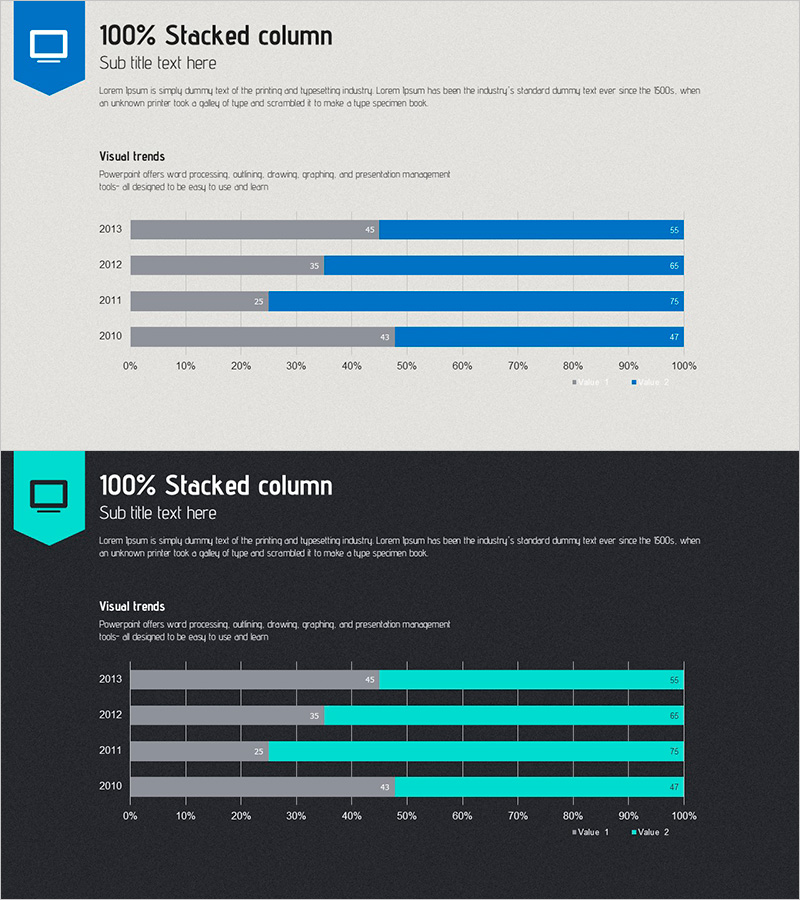
A PowerPoint slide featuring a horizontal bar segmentation chart visualizing business progress from 2010 to 2013 across four years. Each year displays two data series in cumulative percentage format, simultaneously showing temporal trends and compositional ratios. The contrast between light gray and deep blue ensures clear data differentiation, with percentage values displayed directly for precise information delivery. This presentation template is ready to use for business strategy, market analysis, competitive comparison, and other professional presentations.
Usage Points
-
Main Usage
Designed to visualize both temporal trends and compositional ratios of business progress by year. The two-series cumulative percentage format effectively communicates growth rates, market share changes, and strategic allocation shifts over time.
-
How to Use
Apply this chart in the performance analysis section of business reports, progress tracking pages in strategy presentations, or market analysis charts in marketing plans. Simply edit the bar values and colors to input actual data for immediate presentation use.
-
Recommended For
Business managers, marketing planners, executive report coordinators, consultants, and analysts presenting quantitative data. Particularly recommended for year-over-year progress reports, market analysis, and strategic planning presentations requiring temporal comparison.
-
Slide Structure
Two-slide layout with light background and blue accent on the first slide, dark background with cyan accent on the second. Each slide features a horizontal bar chart with four years (2010–2013) on the Y-axis, 0–100% range on the X-axis, two cumulative data series, and percentage values displayed at bar endpoints.
Related Products
-

Bar Graph Analysis for Business Strategy – Market Diagnosis
#Business Strategy #Market and Competitor Analysis #Graph
-

Bar Chart for Market Analysis Visualization – Innovation and Growth
#Business Strategy #Market and Competitor Analysis #Graph
-

Bar Graph Visualization of Pet Data
#Market and Competitor Analysis #Financial Plans and Performance #Graph
-

Pie Chart & Bar Graph for Market Analysis – Visualizing Data
#Market and Competitor Analysis #Graph #Market Status
