Learning Goal Deflection Line Graph – Business Strategy
RJ0500043_27
- Last Update 06/19/2025
- File Size 0.4MB
- # of Slides 2
- File Format PPTX
- Slide Ratio 16:9
- Color
Keywords
- #Content-Based Slides
- #Design-Based Slides
- #Business Strategy
- #Market and Competitor Analysis
- #Graph
- #Competitive Advantage
- #Line
- #Line Chart
- #Project Progress
- #16:9
- #line chart PowerPoint
- #dual-series trend graph
- #business performance slide
- #10-year comparison chart
- #executive report template
- #market analysis PowerPoint slide
About the Product
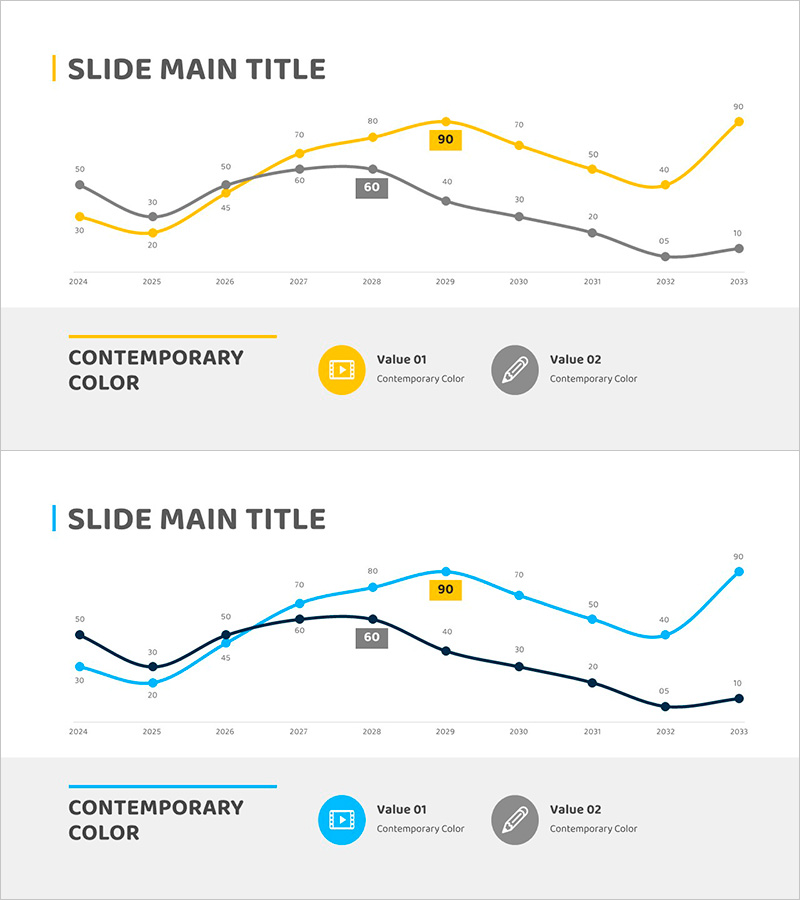
A dual-line trend chart PowerPoint slide designed to visualize business progress and performance metrics over time. The chart features two distinct data series in contrasting yellow and gray colors, tracking changes from 2024 to 2033 across ten years. Each data point is labeled with precise numerical values, and peak and minimum values are highlighted to emphasize key performance indicators. This presentation template is ready for immediate use in executive reports, business performance analysis, market trend presentations, and strategic planning sessions. The clean layout and color-coded series make it easy for audiences to compare two independent metrics simultaneously.
Usage Points
-
Main Usage
Quantitatively compare business progress and competitive advantage by displaying two independent metrics simultaneously. The dual-line format reveals correlations and trend patterns at a glance, strengthening credibility in executive presentations and strategic business reports.
-
How to Use
Use in executive briefing sessions, quarterly or annual business performance presentations, market analysis comparisons, and competitive positioning meetings. Edit the data values to reflect your organization's actual KPIs, revenue trends, market share evolution, or other key metrics.
-
Recommended For
Executives, business strategists, marketing managers, financial analysts, management consultants, and data-driven decision makers. Ideal for long-term trend analysis, performance benchmarking, investor presentations, and strategic planning meetings requiring quantitative evidence.
-
Slide Structure
Title area at top, central chart area featuring 2-series line graph with 10 data points and highlighted peak/minimum values, legend area at bottom with Value 01 and Value 02 icons. Optimized for 16:9 widescreen format as a 2-slide set.
Related Products
-

Square Frame Presentation Template for Line Chart – Market and Competitive Analysis
#Business Strategy #Market and Competitor Analysis #Graph
-

Triangular Pattern Presentation Template – Business Strategy & Market Analysis
#Business Strategy #Market and Competitor Analysis #Graph
-

Social Network Wide Template Line Chart - Market Competition Analysis
#Business Strategy #Market and Competitor Analysis #Graph
-

Five Color Wide Template – Horizontal Line Graph for Business Strategy
#Business Strategy #Market and Competitor Analysis #Graph
