Social Network Wide Template Line Chart - Market Competition Analysis
RJ0200055_11
- Last Update 04/14/2025
- File Size 0.2MB
- # of Slides 2
- File Format PPTX
- Slide Ratio 16:9
- Color
Keywords
- #Content-Based Slides
- #Design-Based Slides
- #Business Strategy
- #Market and Competitor Analysis
- #Graph
- #Competitive Advantage
- #Line
- #Line Chart
- #Project Progress
- #16:9
- #line chart PowerPoint slide
- #multi-series trend analysis
- #market competition analysis chart
- #business trend graph
- #6-year comparison slide template
About the Product
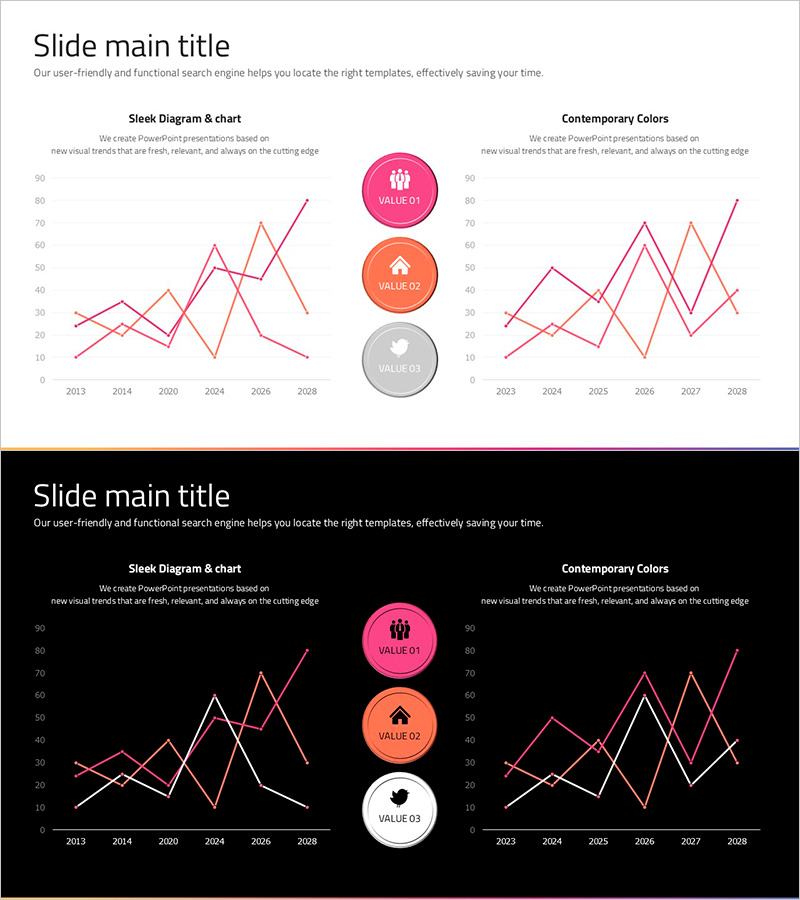
A professional line chart PowerPoint slide visualizing market trends from 2013 to 2028 with three data series. The design features a contemporary color palette of pink, orange, and gray, making it ideal for business presentations and competitive analysis reports. The left slide displays the chart on a light background with crisp lines emphasizing trend clarity, while the right slide presents the same data against a dark background for premium visual impact. Three circular icons (VALUE 01, 02, 03) are positioned on the right to highlight key metrics. This multi-series line graph template is ready for immediate use in market analysis, business progress reports, and trend analysis presentations.
Usage Points
-
Main Usage
Visualizes long-term market trends, competitive comparisons, and business performance metrics across three data series simultaneously. The pink, orange, and gray color scheme clearly differentiates each data series, while circular icons emphasize the significance of each metric.
-
How to Use
Use the light background slide for general meetings and client presentations, and the dark background slide for executive briefings and premium presentations. Click on data points to input your own figures, and the chart updates automatically. Edit the VALUE icon labels to add your key messages.
-
Recommended For
Ideal for marketing teams presenting market analysis, executives reporting business performance, investors explaining market trends, consulting firms conducting competitive analysis, and finance teams analyzing revenue progression. Particularly effective for strategic meetings requiring multi-series comparisons.
-
Slide Structure
Each slide contains a title area, a three-series line graph (Y-axis 0-90, X-axis 2013-2028), and three circular icons (VALUE 01, 02, 03) positioned on the right. The light background version features distinct pink, orange, and gray lines, while the dark background version presents the same colors with high contrast for visual prominence.
Related Products
-

Square Frame Presentation Template for Line Chart – Market and Competitive Analysis
#Business Strategy #Market and Competitor Analysis #Graph
-

Five Color Wide Template – Horizontal Line Graph for Business Strategy
#Business Strategy #Market and Competitor Analysis #Graph
-

Triangular Pattern Presentation Template – Business Strategy & Market Analysis
#Business Strategy #Market and Competitor Analysis #Graph
-

Learning Goal Deflection Line Graph – Business Strategy
#Business Strategy #Market and Competitor Analysis #Graph
