Five Color Wide Template – Horizontal Line Graph for Business Strategy
RJ0200009_25
- Last Update 03/30/2025
- File Size 4.6MB
- # of Slides 2
- File Format PPTX
- Slide Ratio 16:9
- Color
Keywords
- #Content-Based Slides
- #Design-Based Slides
- #Business Strategy
- #Market and Competitor Analysis
- #Graph
- #Competitive Advantage
- #Line
- #Line Chart
- #Project Progress
- #16:9
- #line chart PowerPoint
- #trend comparison slide template
- #business progress visualization
- #time-series data chart
- #dual-series line graph slide download
About the Product
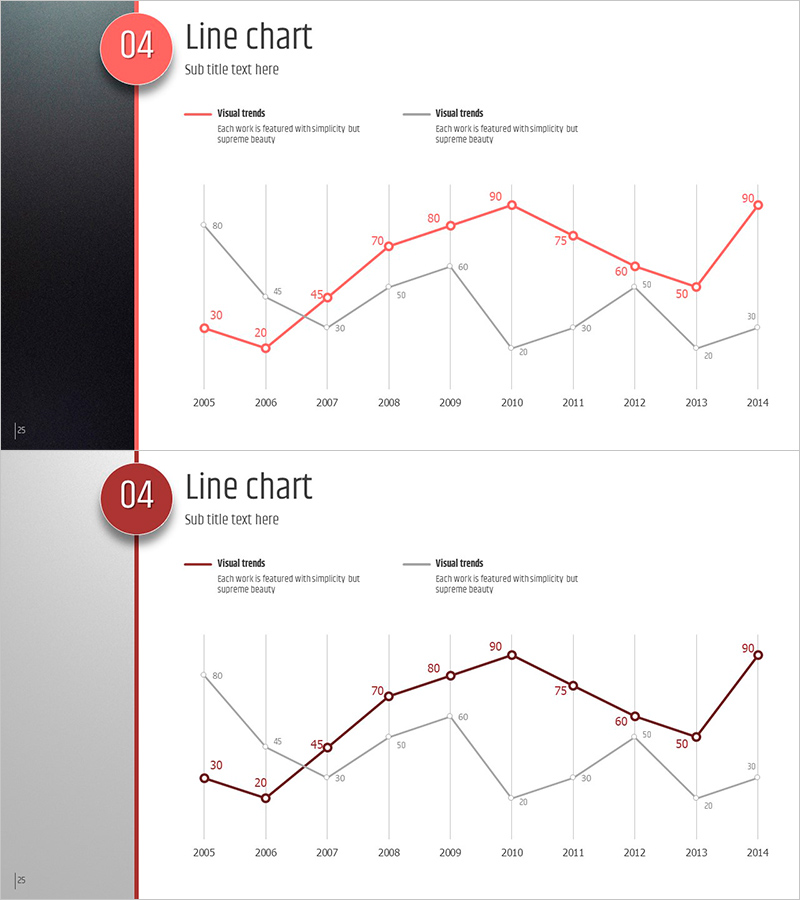
A dual-series line chart PowerPoint slide designed to visualize business progress and market trends over time. This presentation template displays two data series from 2005 to 2014 in a 10-year timeline, with red and gray lines providing clear contrast for trend comparison. Each data point is labeled with numerical values for precise communication, and vertical gridlines mark yearly intervals for easy reference. The 2-slide set offers the same chart in two color schemes: a dark background version for evening presentations and a light background version for daytime settings. Formatted in 16:9 widescreen and fully editable PPTX, allowing quick customization of data, colors, and labels to match your corporate branding.
Usage Points
-
Main Usage
Effectively visualize two-series data trends over time, such as business performance metrics, market share evolution, competitive benchmarking, and KPI tracking. Ideal for executive reports, business plans, marketing proposals, and investor presentations where clear comparison of growth trajectories and performance indicators is essential.
-
How to Use
Replace the sample data points and numerical labels with your actual figures. Customize the red and gray line colors to match your corporate identity, and edit the legend and axis labels as needed. Use the dark background slide for evening or formal presentations, and the light background slide for daytime or casual settings.
-
Recommended For
Executive and C-suite quarterly or annual business reviews, marketing teams analyzing market share and customer acquisition trends, sales teams comparing revenue growth and target achievement, finance teams tracking profitability and cost evolution, and consulting firms presenting benchmarking analysis.
-
Slide Structure
2-slide set. Each slide features a title area (numbered 04 with 'Line chart' label), legend section (2-series descriptions), and main chart body with X-axis spanning 2005–2014, Y-axis ranging 0–90, dual-line visualization with data point labels and vertical gridlines. Top slide uses dark gray background; bottom slide uses light gray background for versatile presentation contexts.
Related Products
-

Social Network Wide Template Line Chart - Market Competition Analysis
#Business Strategy #Market and Competitor Analysis #Graph
-

Triangular Pattern Presentation Template – Business Strategy & Market Analysis
#Business Strategy #Market and Competitor Analysis #Graph
-

Learning Goal Deflection Line Graph – Business Strategy
#Business Strategy #Market and Competitor Analysis #Graph
-

Square Frame Presentation Template for Line Chart – Market and Competitive Analysis
#Business Strategy #Market and Competitor Analysis #Graph
