Circular Gradient Table – Financial Performance and Differentiation
RJ0200056_16
- Last Update 04/14/2025
- File Size 1.7MB
- # of Slides 2
- File Format PPTX
- Slide Ratio 16:9
- Color
Keywords
- #Content-Based Slides
- #Design-Based Slides
- #Financial Plans and Performance
- #Diagram
- #Balance Sheet
- #Cash Flow Statement
- #Table
- #Standard Table
- #16:9
- #table PowerPoint slide
- #financial analysis presentation
- #gradient table design
- #data comparison slide
- #performance metrics PPT
- #how to create comparison table in PowerPoint
About the Product
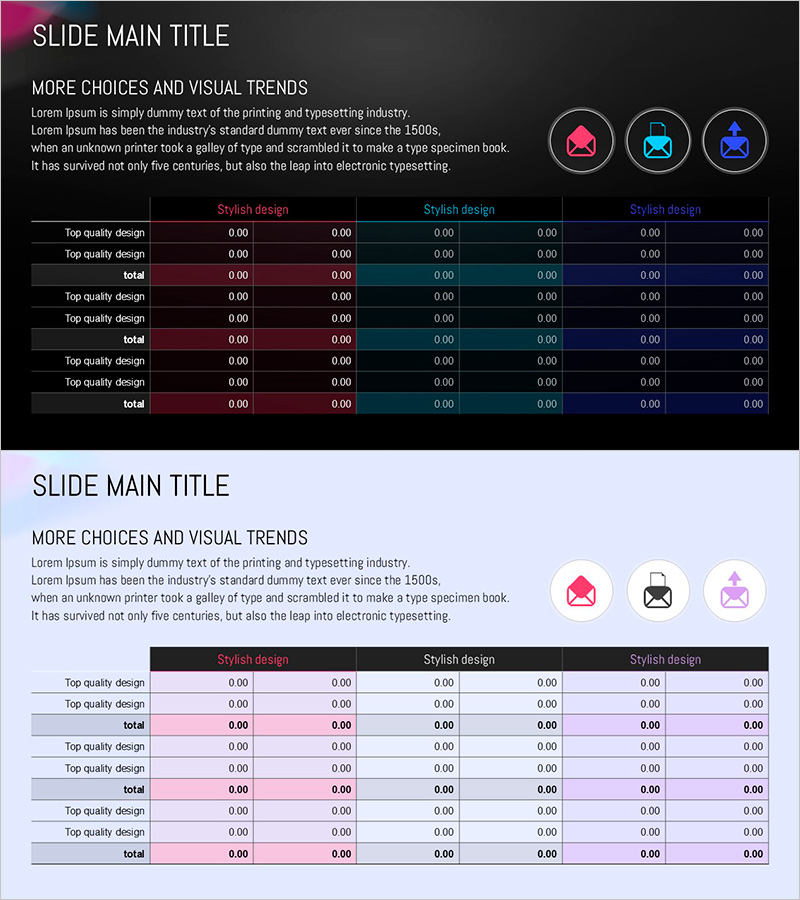
A three-color gradient table PowerPoint slide designed to visualize financial performance and competitive differentiation. Set against a dark background, the slide features pink, cyan, and purple gradient headers that clearly distinguish each section. The 2-slide deck includes descriptive text and icons at the top, with an editable data table below for numerical input. Ideal for financial analysis, performance benchmarking, quality assessment, and quantitative reporting in executive presentations.
Usage Points
-
Main Usage
Visualize quantitative data such as financial metrics, quality scores, and business KPIs in a structured table format. The three gradient header colors enable clear section differentiation, making numerical comparisons intuitive and visually distinct.
-
How to Use
Enter section titles and descriptions in the top text area, then populate the table below with financial figures, performance indicators, or quality metrics. Each of the three sections uses a different color gradient, allowing you to organize and compare categorical data effectively.
-
Recommended For
Quarterly financial performance reports, executive business reviews, investor presentations, departmental KPI comparisons, quality management result sharing, and competitive analysis briefings.
-
Slide Structure
2-slide template. Each slide features a title and descriptive text area with three icons at the top, and a three-section table below (each section: 2 rows × 6 columns). Pink, cyan, and purple gradient headers distinguish sections. All cells are fully editable for custom data entry.
Related Products
-

Four Color Infographic Presentation Table – Visualizing Financial Performance
#Financial Plans and Performance #Diagram #Balance Sheet
-

Data Analysis Table – Visualization of Financial Planning and Performance
#Financial Plans and Performance #Diagram #Balance Sheet
-

Business Plan PowerPoint Design – Excel Table Utilization
#Financial Plans and Performance #Diagram #Balance Sheet
-

Triangular Pattern Presentation Table - Financial Plans and Performance
#Financial Plans and Performance #Diagram #Balance Sheet
