Spring Pastel Wide PowerPoint Template Tables – Design for Financial Performance
RJ0200063_22
- Last Update 04/17/2025
- File Size 0.3MB
- # of Slides 2
- File Format PPTX
- Slide Ratio 16:9
- Color
Keywords
- #Content-Based Slides
- #Design-Based Slides
- #Financial Plans and Performance
- #Diagram
- #Balance Sheet
- #Cash Flow Statement
- #Table
- #Standard Table
- #16:9
- #financial data table PowerPoint
- #table slide template
- #data comparison chart PPT
- #budget table PowerPoint
- #pastel table slide design
- #horizontal table presentation template
About the Product
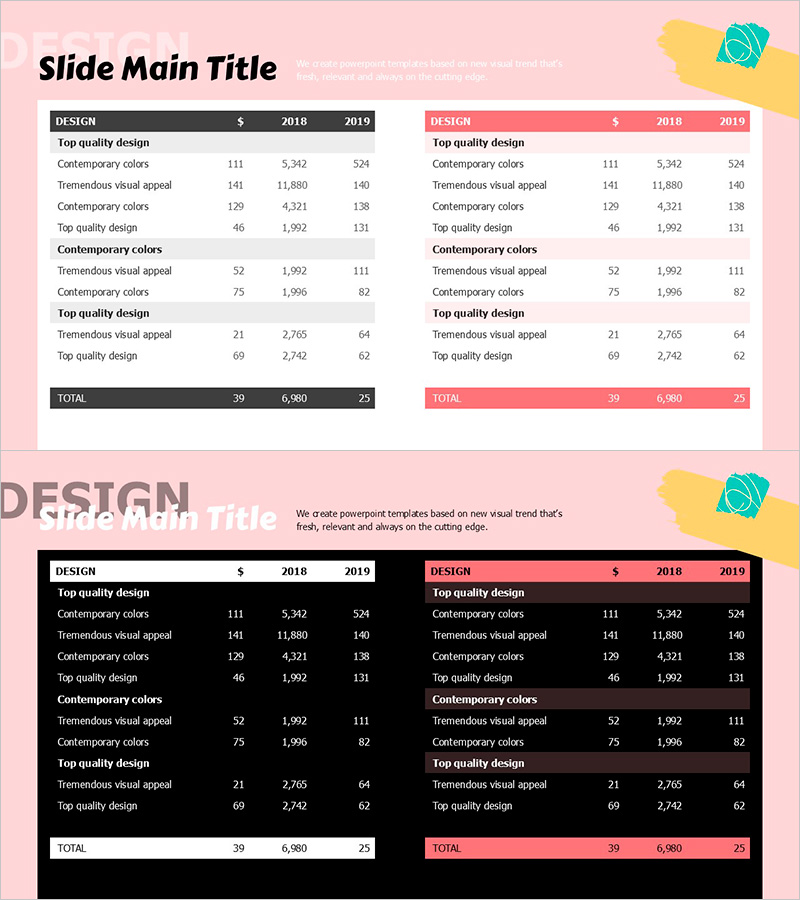
A financial performance analysis table PowerPoint slide designed with spring pastel tones of pink and gray. The 2-slide set features horizontally-oriented 2-row table structures with data input fields for design, cost, and year-by-year figures. The header row uses dark gray, while data rows alternate between white and light pink backgrounds for enhanced readability. Ideal for quarterly reports, budget comparisons, and financial performance presentations in business proposals, annual reports, and financial planning documents.
Usage Points
-
Main Usage
Presents financial performance, budget status, quarterly results, and year-over-year comparisons in a clear, organized table format. The color-coded header and data rows emphasize information hierarchy, while the pastel pink and gray tones convey both professionalism and approachability in financial communications.
-
How to Use
Enter numerical data and item names directly into table cells for insertion into financial reports, business plans, and quarterly performance presentations. Two slides allow comparison of multiple datasets, and the color scheme and layout can be customized to match existing presentation materials.
-
Recommended For
Finance teams, executives, and business managers presenting quarterly results, budget status, and annual performance to stakeholders, investors, and boards. Also suitable for marketing teams analyzing campaign performance, sales teams comparing revenue figures, and project managers tracking progress metrics.
-
Slide Structure
2 slides with horizontally-oriented 2-row table layout. Each table features a dark gray header row (4 columns: Design, $, 2018, 2019) and 9 data rows alternating between white and light pink backgrounds. Optimized for 16:9 widescreen format in fully editable PPTX.
Related Products
-

Circular Gradient Table – Financial Performance and Differentiation
#Financial Plans and Performance #Diagram #Balance Sheet
-

Slide Visualizing Financial Plans with Diagonal Box and Table
#Financial Plans and Performance #Diagram #Balance Sheet
-

Data Analysis Table – Visualization of Financial Planning and Performance
#Financial Plans and Performance #Diagram #Balance Sheet
-

Volume Presentation Template - Laptop Mockup and Table Chart for Modern Proposals
#Financial Plans and Performance #Diagram #Other
