Data Analysis Table – Visualization of Financial Planning and Performance
RB0800076_8
- Last Update 03/28/2025
- File Size 0.2MB
- # of Slides 2
- File Format PPTX
- Slide Ratio 4:3
- Color
Keywords
About the Product
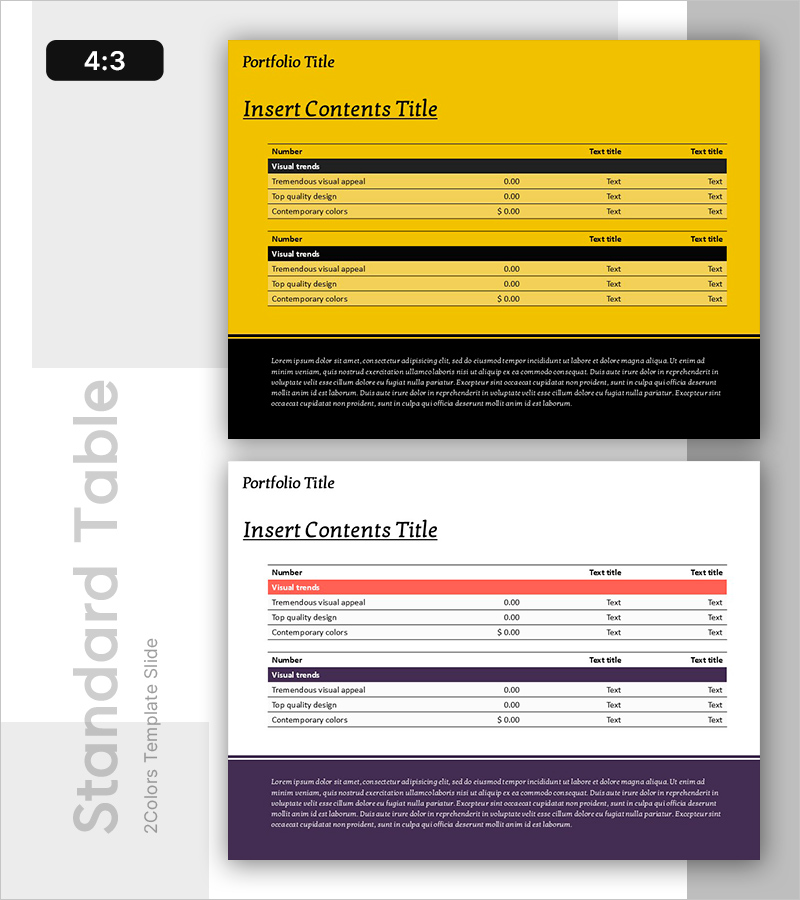
A data analysis table PowerPoint slide for comparing financial planning and performance metrics side by side. This presentation template features two distinct layouts: one with a yellow background and another with a white background, each containing a structured table with four key metrics including Visual trends, Tremendous visual appeal, Top quality design, and Contemporary colors. The slide deck includes numerical values and text fields for easy customization. Available in 4:3 aspect ratio with 2 slides, ready for immediate use in financial reports, performance analysis, and business presentations to visualize data systematically.
Usage Points
-
Main Usage
Organize and compare financial data and performance indicators in a structured tabular format. Use this slide to display budget versus actual results, target versus achievement rates, quarterly performance metrics, and other numerical information to support data-driven decision making.
-
How to Use
Replace the sample data in each table row with your own financial metrics and values. The colored header rows serve as category labels, while the data rows are designated for your numerical inputs. Simply edit the text fields to insert your specific metric names and corresponding figures.
-
Recommended For
Finance teams, executives, and business managers preparing quarterly and annual performance reports, investor presentations, and management meetings. Ideal for visualizing budget execution status, revenue analysis, KPI achievement rates, and departmental performance comparisons.
-
Slide Structure
Two slides with identical 2-row table layouts. The first slide features a yellow background with black headers and yellow data rows; the second slide uses a white background with red and black headers and white data rows. Each table contains four columns: Number, Visual trends, numerical value, and two Text title fields for flexible data entry.
Related Products
-

Circular Gradient Table – Financial Performance and Differentiation
#Financial Plans and Performance #Diagram #Balance Sheet
-

Volume Presentation Template - Laptop Mockup and Table Chart for Modern Proposals
#Financial Plans and Performance #Diagram #Other
-

Spring Pastel Wide PowerPoint Template Tables – Design for Financial Performance
#Financial Plans and Performance #Diagram #Balance Sheet
-

Triangular Pattern Presentation Table - Financial Plans and Performance
#Financial Plans and Performance #Diagram #Balance Sheet
