Slide Visualizing Financial Plans with Diagonal Box and Table
RJ0600064_17
- Last Update 07/07/2025
- File Size 0.4MB
- # of Slides 2
- File Format PPTX
- Slide Ratio 16:9
- Color
Keywords
- #Content-Based Slides
- #Design-Based Slides
- #Financial Plans and Performance
- #Diagram
- #Balance Sheet
- #Cash Flow Statement
- #Table
- #Standard Table
- #16:9
- #financial planning table PowerPoint
- #balance sheet slide template
- #cash flow statement PPT
- #financial data table slide
- #business plan table design
- #financial report PowerPoint template
About the Product
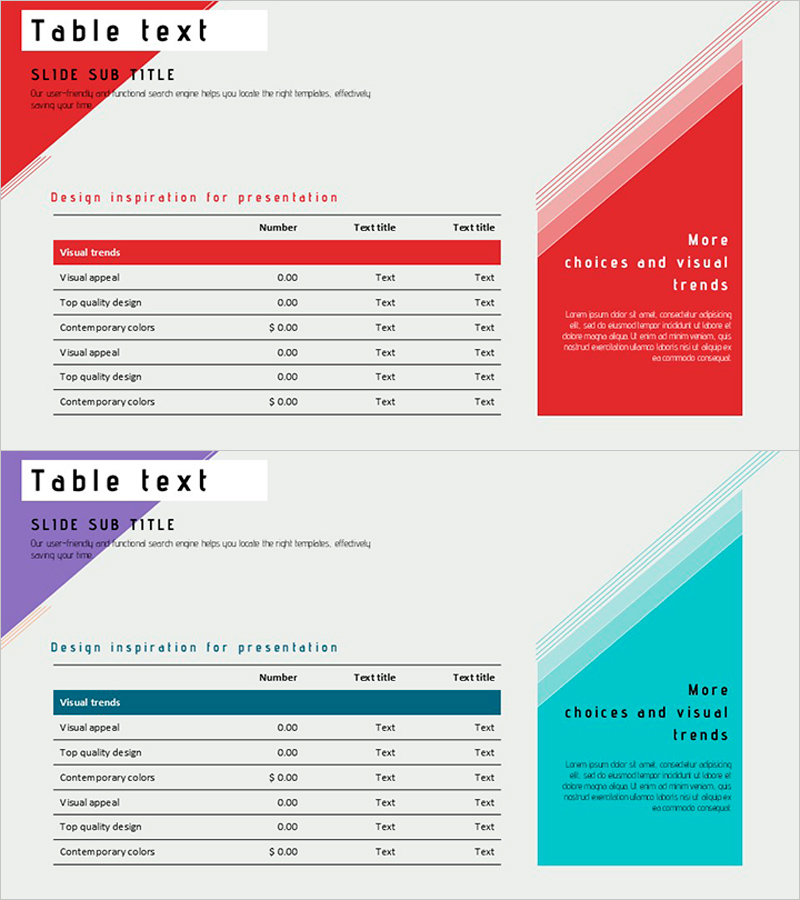
A two-slide PowerPoint presentation template for visualizing financial plans and cash flow using structured table layouts. Available in red and purple color schemes, each slide features a diagonal box accent in the upper left corner and a highlighted emphasis area on the right. The table structure includes clearly defined rows and columns for budget items, financial metrics, and numerical data entry. Ideal for financial reports, business plans, investment proposals, and quarterly reviews. Formatted in 16:9 widescreen for modern presentation environments with fully editable cells and text fields.
Usage Points
-
Main Usage
Present financial data and numerical information in a structured table format to investors and stakeholders, making complex financial information immediately comprehensible. The diagonal box accent highlights key metrics while the row-column structure organizes data logically for clear financial communication.
-
How to Use
Use in the financial projections section of business plans, financial status slides in investor presentations (IR), and budget overview pages in quarterly reports. Simply input your financial figures and labels into the table cells, and customize rows or columns as needed for your specific data.
-
Recommended For
CFOs, financial managers, business planning teams, investor relations professionals, management consultants, and startup founders presenting financial performance, forecasts, or comparative analysis. Particularly suited for finance, accounting, and business management presentations.
-
Slide Structure
Slide 1 (red scheme): diagonal box title area in upper left, 3-column × 7-row editable table in center (item names, figures, text fields), emphasis box on right. Slide 2 (purple scheme): identical layout with color variation. All cells are fully editable and ready for immediate data input and presentation use.
Related Products
-

Triangular Pattern Presentation Table - Financial Plans and Performance
#Financial Plans and Performance #Diagram #Balance Sheet
-

Data Analysis Table – Visualization of Financial Planning and Performance
#Financial Plans and Performance #Diagram #Balance Sheet
-

Business Plan PowerPoint Design – Excel Table Utilization
#Financial Plans and Performance #Diagram #Balance Sheet
-

Spring Pastel Wide PowerPoint Template Tables – Design for Financial Performance
#Financial Plans and Performance #Diagram #Balance Sheet
