Shareholder Status Analysis Slide – Data-Driven Market Insights
RM0300007_7
- Last Update 02/08/2025
- File Size 1MB
- # of Slides 2
- File Format PPTX
- Slide Ratio 16:9
- Color
Keywords
- #Content-Based Slides
- #Design-Based Slides
- #Company Introduction
- #Market and Competitor Analysis
- #Diagram
- #Graph
- #Shareholder Structure
- #Market Analysis
- #Table
- #Circles
- #Standard Table
- #Doughnut Chart
- #16:9
- #donut chart PowerPoint slide
- #pie chart presentation template
- #shareholder composition analysis
- #data visualization slide
- #market share diagram
About the Product
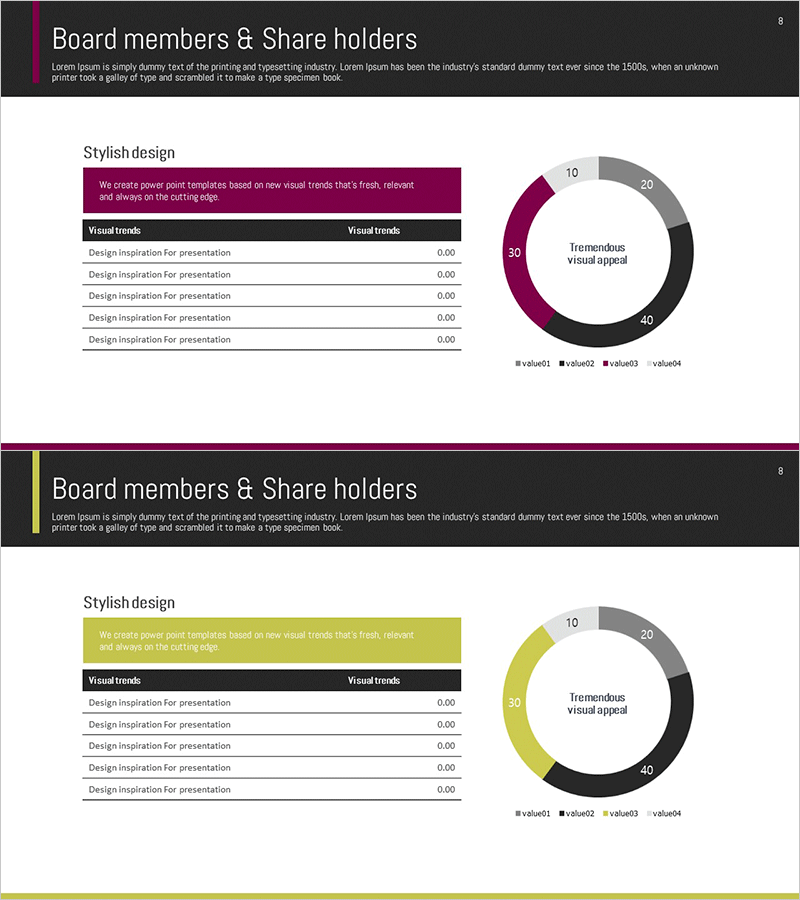
A donut chart PowerPoint slide designed to visualize shareholder composition and market share distribution. The slide features a four-segment circular graph with a central text area for highlighting key metrics or messages. Color-coded segments in deep burgundy, black, gray, and light gray create clear visual distinction between data categories. A legend at the bottom ensures accurate data interpretation. This presentation slide is ready to use in corporate introductions, investor presentations, and quarterly earnings reports.
Usage Points
-
Main Usage
Displays proportional relationships such as shareholder composition, market share, or asset allocation at a glance. The hollow center of the donut allows for emphasis of key figures or messages, while four color-coded segments ensure each category is visually distinct and easy to interpret.
-
How to Use
Ideal for corporate overview slides showing shareholder structure, investor presentations explaining equity distribution, quarterly or annual reports analyzing market share, and business diversification updates. Data values can be entered directly, with proportions automatically reflected in the chart.
-
Recommended For
CFOs, finance teams, investor relations professionals, and executives presenting to shareholders and investors. Also suitable for consulting firms and marketing teams analyzing market competition and competitive positioning.
-
Slide Structure
Two donut chart slides with four data segments each, color-coded for clarity. Central text area allows insertion of key metrics or messages. Bottom legend identifies each segment. Formatted in 16:9 widescreen for compatibility with modern projectors and displays.
Related Products
-

Shareholder Status Analysis Donut Pie Chart – Corporate Growth and Competitive Analysis
#Company Introduction #Market and Competitor Analysis #Diagram
-

Shareholder Status Distribution Analysis Chart – Visualizing Shareholder Information
#Company Introduction #Market and Competitor Analysis #Diagram
-

Status Analysis Donut Chart – Shareholder Status Analysis
#Company Introduction #Market and Competitor Analysis #Diagram
-

Status Analysis Donut Chart – Visualizing Market and Shareholder Status
#Company Introduction #Market and Competitor Analysis #Diagram
