Work Environment Survey Donut Chart – Market Share Visualization
RJ0300028_11
- Last Update 04/25/2025
- File Size 3.5MB
- # of Slides 2
- File Format PPTX
- Slide Ratio 16:9
- Color
Keywords
About the Product
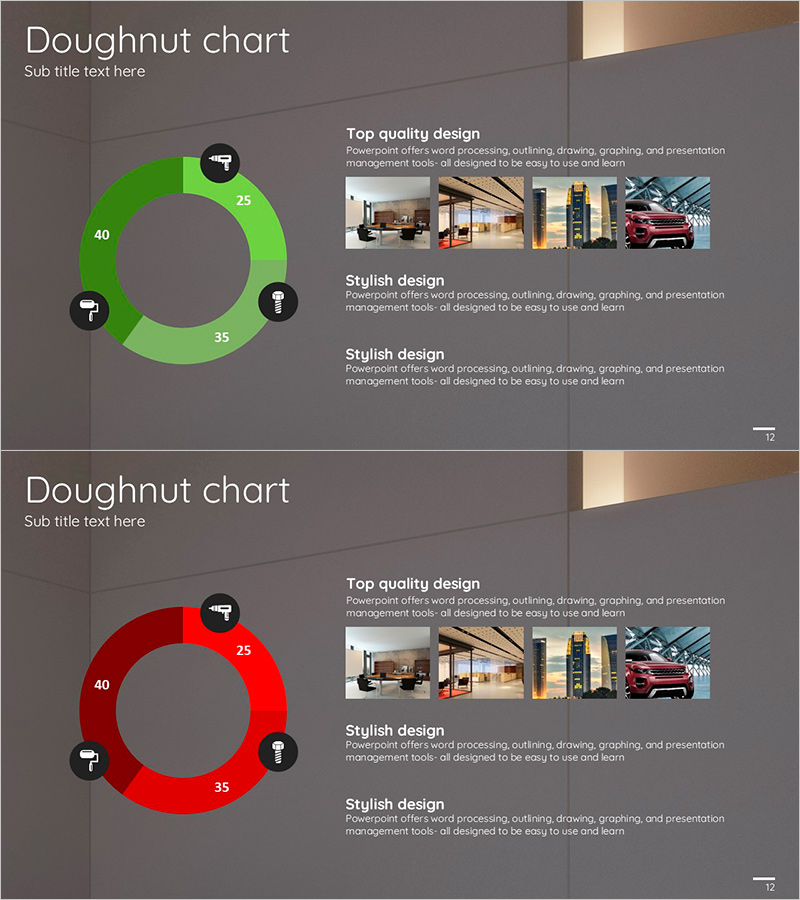
A donut chart PowerPoint slide template designed to visualize the proportional distribution of four key items such as work environment survey results, market share, departmental budget allocation, or customer satisfaction metrics. Available in two color versions—vibrant green and bold red—with numeric labels and icons positioned at each segment to enhance data clarity. Ideal for business analysis reports, marketing presentations, performance reviews, and strategic planning sessions where composition ratios need to be emphasized and communicated effectively to stakeholders.
Usage Points
-
Main Usage
This donut chart is optimized for comparing and highlighting the composition ratio of four data categories at a glance. It effectively communicates market share distribution, departmental budget allocation, work environment survey outcomes, customer satisfaction distribution, and similar proportional data, enabling audiences to grasp key insights instantly.
-
How to Use
Input your actual numerical values into the donut chart template, and the proportions will automatically adjust. Select the green version to convey positive or growth-oriented messages, and the red version for highlighting changes or areas requiring attention. Customize the icons and text labels to align with your presentation topic and organizational branding.
-
Recommended For
Recommended for marketing team market analysis reports, executive-level business performance presentations, departmental budget status briefings, customer satisfaction survey result sharing, product sales volume comparative analysis, and data-driven decision-making meetings. Suitable for any presentation requiring clear visualization of compositional percentages.
-
Slide Structure
Two-slide set. The first slide features a green donut chart with three segments (40, 35, 25 ratio distribution) and a central icon; the second slide presents an identical red donut chart. Each segment includes numeric labels and descriptive text areas, with additional information input space provided on the right side of both slides.
Related Products
-

Equipment Demand Configuration Graph – Effective Visualization for Market Analysis
#Market and Competitor Analysis #Diagram #Graph
-

Market Share Global Map – Real-Time Data for Market Analysis
#Market and Competitor Analysis #Graph #Market Share
-

Analysis of Crime Occurrence Locations – Data Visualization
#Market and Competitor Analysis #Graph #Market Share
-

Red Market Share Slide – Compelling Donut Chart Design
#Market and Competitor Analysis #Graph #Market Share
