Bundled Graphs and Maps for Business Plan Visualization
RJ0200027_27
- Last Update 04/05/2025
- File Size 1.6MB
- # of Slides 2
- File Format PPTX
- Slide Ratio 16:9
- Color
Keywords
- #Content-Based Slides
- #Design-Based Slides
- #Market and Competitor Analysis
- #Graph
- #Other
- #Market Analysis
- #Competitive Advantage
- #Column
- #Grouped Column
- #Map
- #16:9
- #world map PowerPoint slide
- #grouped bar chart template
- #market analysis presentation
- #business data visualization
- #global performance slide template
About the Product
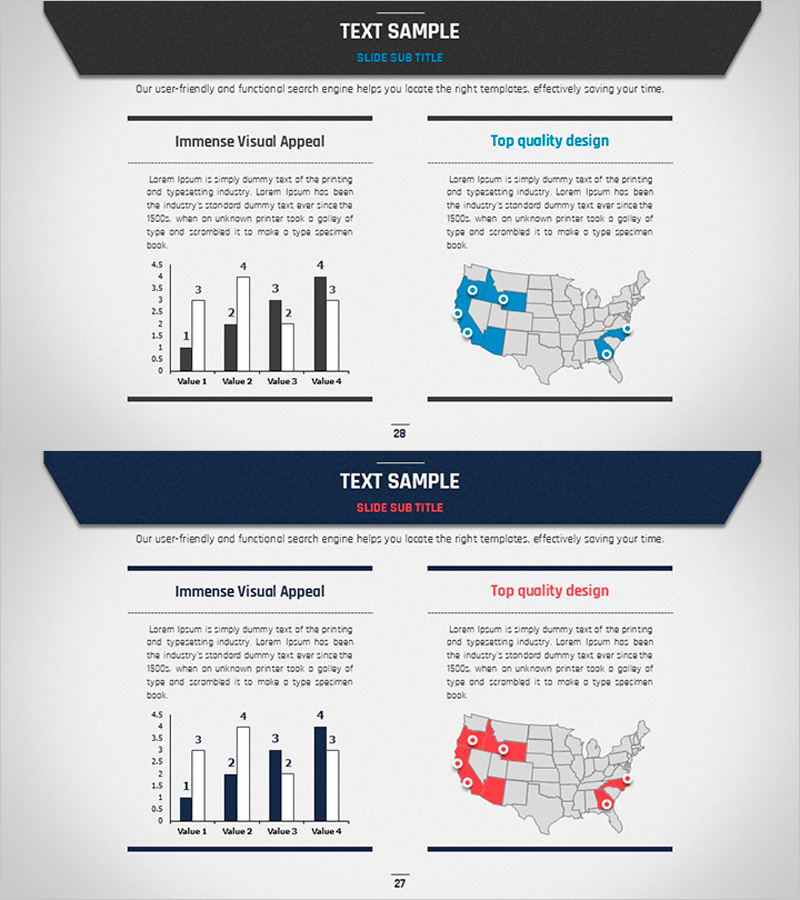
A 2-slide PowerPoint presentation designed for business planning and market analysis presentations. The first slide features a grouped bar chart with 4 items, enabling direct numerical comparison across multiple data series. The second slide displays a world map with blue and red accent markers to visualize global market distribution and regional performance. The minimalist layout with gray background and clear data axes enhances presentation credibility. Optimized for 16:9 widescreen format and provided in fully editable PPTX format for immediate customization.
Usage Points
-
Main Usage
Simultaneously present geographic data and numerical metrics such as global market status, regional sales performance, and country-by-country comparisons. The grouped bar chart compares 4 items across multiple data series, while the world map uses color highlighting to clearly identify key markets or high-performing regions.
-
How to Use
Input actual sales figures, market share percentages, or customer counts into the first slide's bar chart, then highlight corresponding countries or regions on the second slide's map using blue or red markers to display regional performance at a glance. All text and numerical values are fully editable.
-
Recommended For
Executives, marketing teams, and sales departments presenting global market analysis during business strategy development; startups and SMEs explaining market opportunities and regional achievements in investor pitch decks; planning and finance teams visualizing country-specific sales data in quarterly or annual business performance reports.
-
Slide Structure
Slide 1: Grouped bar chart with 4 items (Value 1–4) displaying 2 data series per item (white and black bars) for comparative analysis. Slide 2: World map background with blue and red circular markers and highlighted regions capable of marking 6–8 locations. Both slides include title, subtitle, and descriptive text areas.
Related Products
-

Mobile Service Analysis Graph – Visualizing Market Competitiveness
#Market and Competitor Analysis #Diagram #Graph
-

Bundled Bar Chart by Subject – Visualizing Competitive Advantages
#Market and Competitor Analysis #Graph #Market Analysis
-

Newspaper Wide PowerPoint Template Map3 - Optimized for Market and Competitor Analysis
#Market and Competitor Analysis #Other #Market Analysis
-

Bundled Charts by Category – Market and Competitor Analysis
#Market and Competitor Analysis #Graph #Market Analysis
