Marketing Performance and Analysis – Visualizing Results with Graphs
RJ0600097_16
- Last Update 07/17/2025
- File Size 2MB
- # of Slides 2
- File Format PPTX
- Slide Ratio 16:9
- Color
Keywords
- #Content-Based Slides
- #Design-Based Slides
- #Market and Competitor Analysis
- #Graph
- #Text Box
- #Future Outlook
- #Competitive Advantage
- #Column
- #Grouped Column
- #Rectangle Text Box
- #16:9
- #grouped column chart PowerPoint
- #marketing performance analysis slides
- #data comparison chart template
- #how to create grouped bar chart in PowerPoint
- #marketing results visualization
About the Product
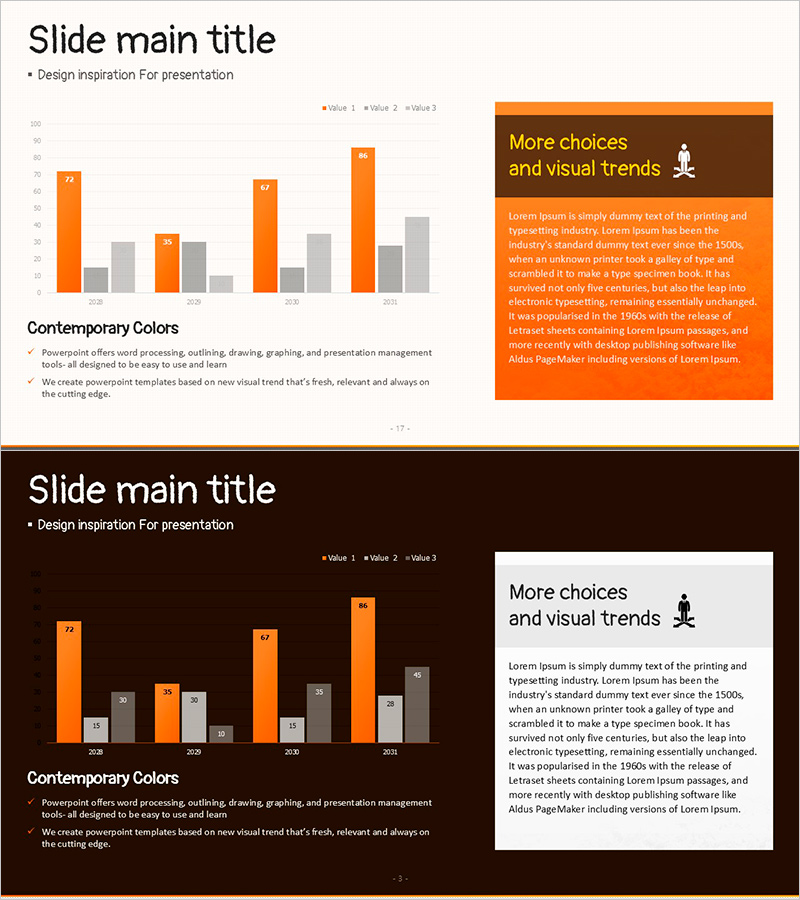
A grouped column chart PowerPoint slide designed to visualize marketing performance and results analysis. The slide presents three data series in orange and gray tones arranged side-by-side, enabling intuitive year-over-year and item-by-item comparative analysis. The 2-slide set includes both light and dark background designs, allowing you to match your presentation environment and document tone. Perfect for marketing reports, quarterly performance presentations, and market analysis materials where numerical comparison and trend explanation are essential.
Usage Points
-
Main Usage
Clearly compare and analyze quarterly and annual marketing performance metrics, and communicate data-driven results intuitively to executives and team members. The 3-series format is ideal for multi-dimensional comparisons such as target vs. actual performance, channel-based results, and time-series trends.
-
How to Use
Use in the performance analysis section of marketing reports, quarterly business review presentations, and marketing strategy planning meetings for historical performance review. Modify the legend and axis labels to match your data, then input target values in orange bars and actual performance in gray bars.
-
Recommended For
Marketing managers, sales directors, business planning teams, and data analysts presenting monthly, quarterly, or annual performance metrics. Particularly useful when comparing multiple indicators simultaneously such as channel revenue, customer acquisition cost, campaign ROI, and brand awareness changes.
-
Slide Structure
Slide 1 features a light background (white/gray) with three data series (orange, gray, gray) displayed as grouped columns across 4 items (2018-2021 or Q1-Q4). Slide 2 presents the same chart on a dark brown background with white text for low-light presentation environments. Legend and title areas are clearly separated for easy data modification.
Related Products
-

Flowering Period Graph – Future Outlook Analysis
#Market and Competitor Analysis #Graph #Future Outlook
-

THE ROAD Presentation Table & Tied Vertical Bar Graph – Market and Competitor Analysis
#Market and Competitor Analysis #Diagram #Graph
-

Bundled Charts for Infinite Energy Analysis
#Market and Competitor Analysis #Graph #Market Status
-

Performer and Line Chart – Market Analysis and Future Outlook
#Market and Competitor Analysis #Graph #Future Outlook
