Space Industry Market Analysis Bar Graph – Providing Strategic Insights
RJ0700020_24
- Last Update 07/27/2025
- File Size 1.1MB
- # of Slides 2
- File Format PPTX
- Slide Ratio 16:9
- Color
Keywords
- #Content-Based Slides
- #Design-Based Slides
- #Market and Competitor Analysis
- #Graph
- #Competitor Analysis
- #Market Analysis
- #Horizontal Bar
- #Segmented Horizontal Bar
- #16:9
- #horizontal bar chart PowerPoint
- #time series data visualization
- #bar graph slide template
- #market analysis chart
- #comparative data presentation
- #how to create bar chart in PowerPoint
About the Product
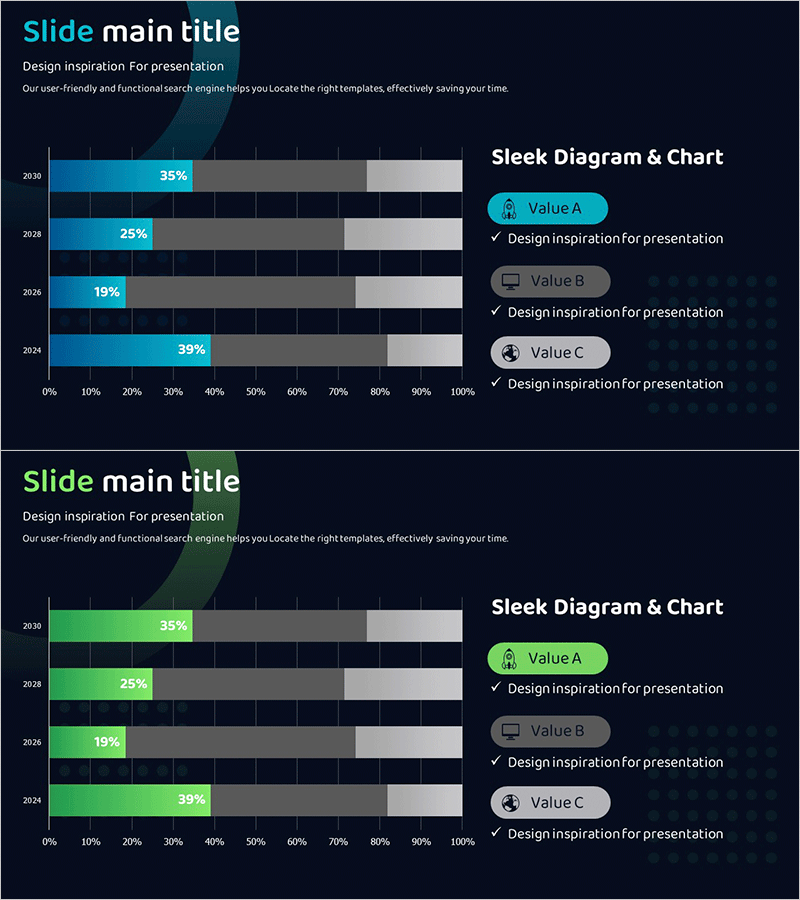
A horizontal bar chart PowerPoint slide designed for space industry market analysis and strategic insights. This presentation template visualizes four years of market data (2030, 2028, 2026, 2024) with specific percentages (35%, 25%, 19%, 39%) displayed on cyan-blue bars against a dark navy background. The slide deck effectively communicates competitive analysis, market share trends, and growth rates for business presentations. Ideal for market reports, investment pitches, and strategic planning documents, this PPTX file is fully editable and ready to customize with your own data.
Usage Points
-
Main Usage
This horizontal bar chart visualizes numerical comparisons across multiple time periods or categories. It effectively presents market size, revenue, market share, and growth rates in an intuitive format that enhances audience comprehension and supports data-driven decision-making. Horizontal orientation is particularly efficient for comparing four or more items.
-
How to Use
Incorporate this slide into business plans, market analysis reports, and investor pitch decks within market overview and competitive analysis sections. Adjust bar lengths to represent actual data values, use color emphasis to highlight key metrics, and leverage the legend area to display multiple data series (Value A, B, C). Easily update percentages and labels for your specific analysis.
-
Recommended For
Strategic planning teams, marketing departments, finance teams, and executives preparing analytical presentations. Ideal for aerospace, space technology, advanced manufacturing, and energy sector market analysis. Suitable for quarterly and annual performance comparisons, competitive benchmarking reports, and board-level strategic reviews.
-
Slide Structure
Two-slide set featuring horizontal bar charts with four data points (2030, 2028, 2026, 2024) per slide. Cyan-blue bars display percentage values (35%, 25%, 19%, 39%) directly on the bars, with a legend showing Value A, B, and C on the right side for multi-series comparison. 16:9 widescreen format optimized for modern projectors and displays.
Related Products
-

VR Market Analysis Bar Graph – Understanding Competitive Landscape
#Market and Competitor Analysis #Graph #Competitor Analysis
-

Market Analysis Bar Graph – Effective Visualization for Competitor Analysis
#Market and Competitor Analysis #Graph #Competitor Analysis
-

Body Organ Analysis Subdivision Graph - Market and Competitor Comparison
#Market and Competitor Analysis #Graph #Competitor Analysis
-

Business Service Analysis Segmentation Graph – Ideal for Market and Competitor Analysis
#Market and Competitor Analysis #Graph #Competitor Analysis
