Market Analysis by Year Horizontal Bar Graph
RJ0400032_6
- Last Update 05/26/2025
- File Size 8.4MB
- # of Slides 2
- File Format PPTX
- Slide Ratio 16:9
- Color
Keywords
About the Product
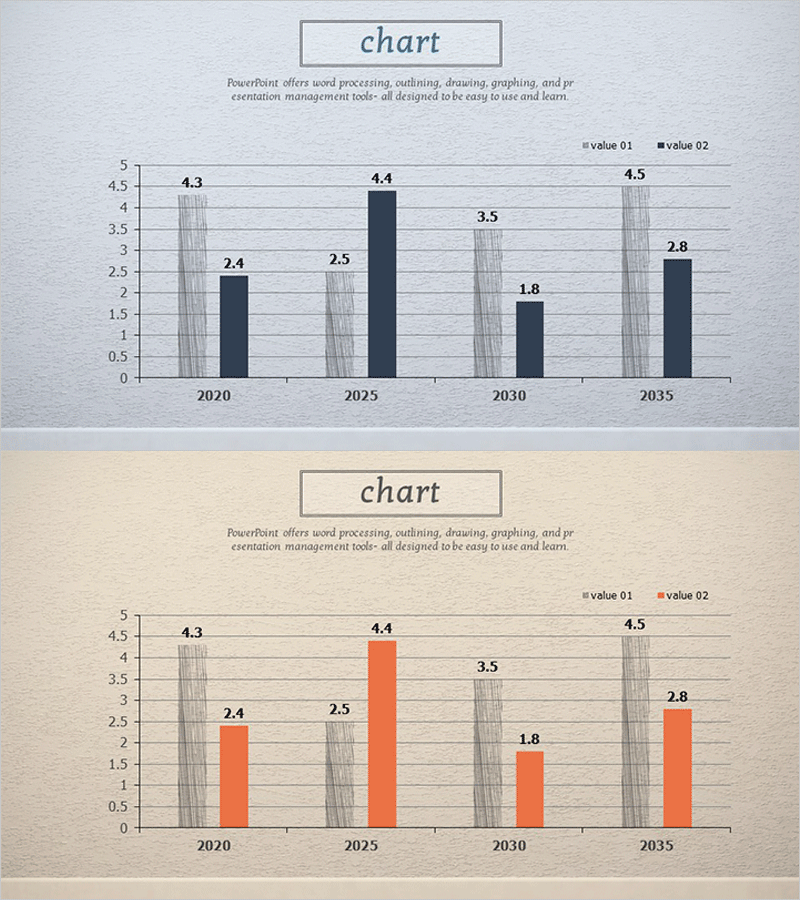
This free clustered column chart slide compares market analysis data across years with two data series. The PowerPoint slide features a professional design with gray striped and dark/orange bars, ready to insert into business plans, reports, and investor presentations. Simply replace the title, legend labels, and numerical values to complete your presentation slide. This easy-to-edit PPT slide works for market analysis, competitive comparison, financial metrics, and more. Download free and customize your data visualization instantly. Explore more chart templates and graph slide collections on GoodPello.
Usage Points
-
Main Usage
Visualizes comparison of two data series across time periods or categories. Ideal for displaying market size trends, competitive benchmarks, financial performance metrics, and year-over-year analysis.
-
How to Use
Replace the title with your analysis topic, update legend labels (value 01, value 02) with actual metric names, and input your data values into the chart. Choose between the default dark or orange color scheme to match your presentation theme.
-
Recommended For
Business plans and reports (market analysis section), investor pitch decks (financial performance comparison), competitive analysis slides, marketing strategy presentations, and quarterly business reviews.
-
Slide Structure
Single-slide design featuring title area, clustered column chart (4 year categories × 2 data series), legend, and descriptive text for complete data storytelling.
Related Products
-

Competitor Analysis and Market Trend Graph – Blue, Orange, Green Colors
#Free Graphs
-

Comparative Analysis Bar Graph – Market and Competitor Analysis
#Free Graphs
-

Bar Chart of Decline & Rise Analysis – Emphasizing Market Competitiveness
#Free Graphs
-

Data Visualization with Bar Charts – Presentation for Efficient Choices
#Free Graphs
