Vertical Bar Chart Visualizing Candidate Values – Trends and Choices
RJ0800041_11
- Last Update 08/11/2025
- File Size 0.5MB
- # of Slides 2
- File Format PPTX
- Slide Ratio 16:9
- Color
Keywords
About the Product
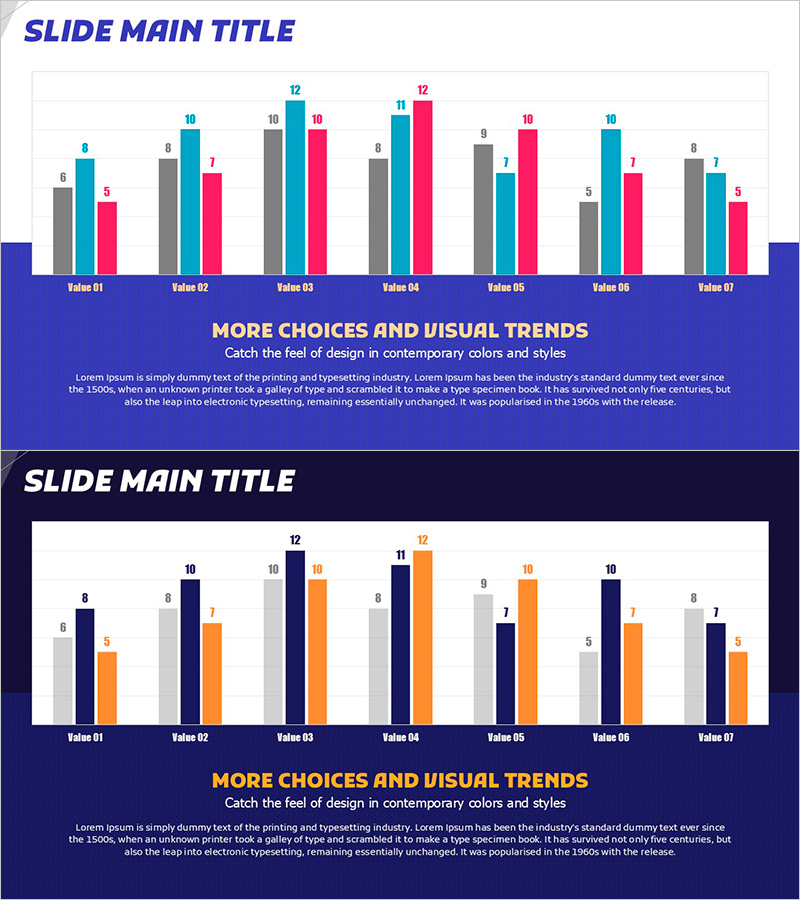
This free PowerPoint slide features a grouped vertical bar chart comparing three data series across seven categories (Value 01–07), available in two color themes: a light version with gray, cyan, and pink-red bars, and a dark version with gray, navy, and orange bars. Each bar includes a numeric label at the top for clear data readability, and the lower navy blue panel provides dedicated areas for a title, subtitle, and body text, allowing you to present both data and context on a single slide. The structured three-column grouping makes it easy to compare multiple datasets side by side, making this presentation slide ideal for market analysis, competitor benchmarking, quarterly performance reports, and marketing channel comparisons. Simply replace the values and category labels with your own data to adapt this PPT slide to any business presentation. For more free graph slides and premium chart templates, explore the GoodPello free graph collection.
Usage Points
-
Main Usage
This slide is designed to visually compare three data series across seven categories using a grouped vertical bar chart layout, making it ideal for multi-variable comparisons in business and analytical presentations.
-
How to Use
Replace the category labels (Value 01–07) and bar values with your actual data, then enter your title and description in the lower text panel. Choose between the light (cyan/pink-red) or dark (navy/orange) color theme to match your presentation style.
-
Recommended For
Analysts, marketers, strategists, and business presenters who need to compare multiple datasets across categories, such as market share by segment, competitor performance, or quarterly KPI tracking across channels.
-
Slide Structure
Single-slide layout with a grouped vertical bar chart area displaying 7 categories and 3 data series, each bar topped with a numeric label. Lower section features a navy blue background panel with 3 text input areas: title, subtitle, and body text.
Related Products
-

Tree Yellow Purple Area Chart – Innovation in Data Visualization
#Free Graphs
-

Competitive Advantage Bar General Graph – Emphasizing Performance through Market Analysis
#Free Graphs
-

Comparative Analysis Bar Graph – Market and Competitor Analysis
#Free Graphs
-

Data Visualization with Bar Charts – Presentation for Efficient Choices
#Free Graphs
