Market Analysis Graph – Harmony of Pink and Bluegreen
RJ0400010_8
- Last Update 05/19/2025
- File Size 0.2MB
- # of Slides 2
- File Format PPTX
- Slide Ratio 16:9
- Color
Keywords
About the Product
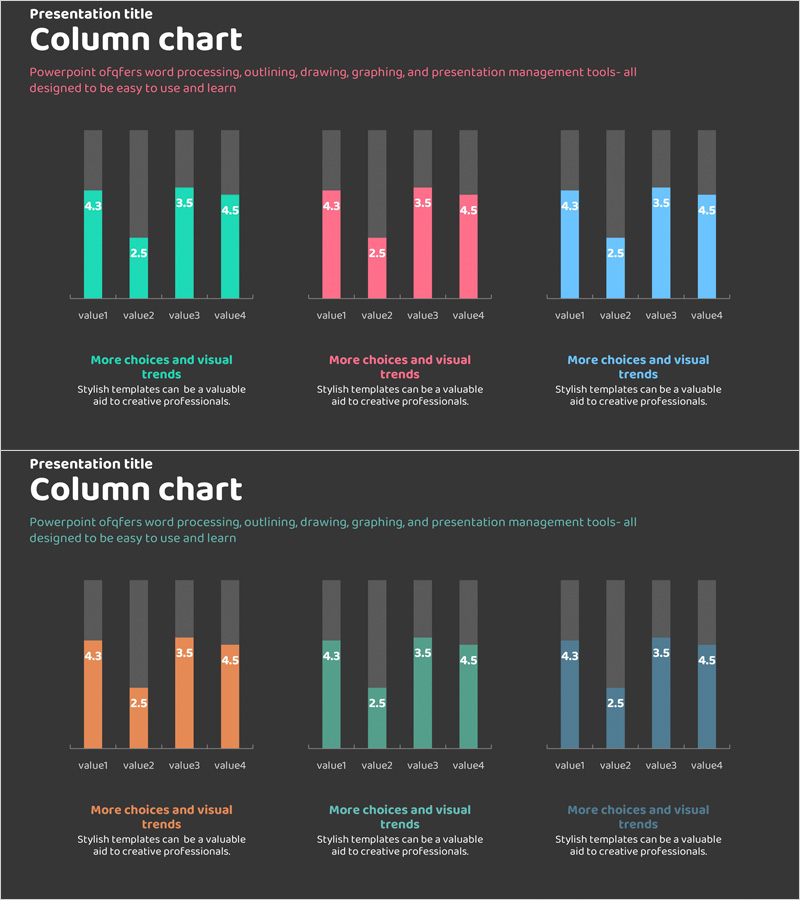
This free PowerPoint slide features three vertical column charts in teal, pink, and light blue colors on a dark background, perfect for comparing four data points across different categories. Ideal for market analysis, competitive comparison, and performance visualization in business presentations. Simply replace the labels and values with your own data to create a professional slide instantly. The minimalist dark design with vibrant accent colors works seamlessly in pitch decks, business plans, investment presentations, and marketing reports. Explore more chart variations and color combinations in GoodPello's premium slide collections.
Usage Points
-
Main Usage
Visualizes comparative data across four items using three distinct color-coded column charts. The dark background and vibrant accent colors enhance data readability and visual impact.
-
How to Use
Replace the value labels (value1–value4) and numerical data with your own information. Update section titles and descriptive text as needed. Color adjustments are simple and straightforward.
-
Recommended For
Business professionals, marketers, and strategists creating business plans, investment pitches, marketing presentations, and quarterly performance reports requiring data comparison visuals.
-
Slide Structure
Single-slide design featuring three independent column chart sections arranged horizontally. Each section displays four vertical bars in teal, pink, or light blue against a dark background with gray reference bars.
Related Products
-

Bar Chart of Decline & Rise Analysis – Emphasizing Market Competitiveness
#Free Graphs
-

Competitive Advantage Bar General Graph – Emphasizing Performance through Market Analysis
#Free Graphs
-

Data Visualization with Bar Charts – Presentation for Efficient Choices
#Free Graphs
-

Vertical Bar Chart Visualizing Candidate Values – Trends and Choices
#Free Graphs
