Five Color PowerPoint Template with Infographic Elements
RJ0200009_8
- Last Update 03/30/2025
- File Size 5.7MB
- # of Slides 2
- File Format PPTX
- Slide Ratio 16:9
- Color
Keywords
About the Product
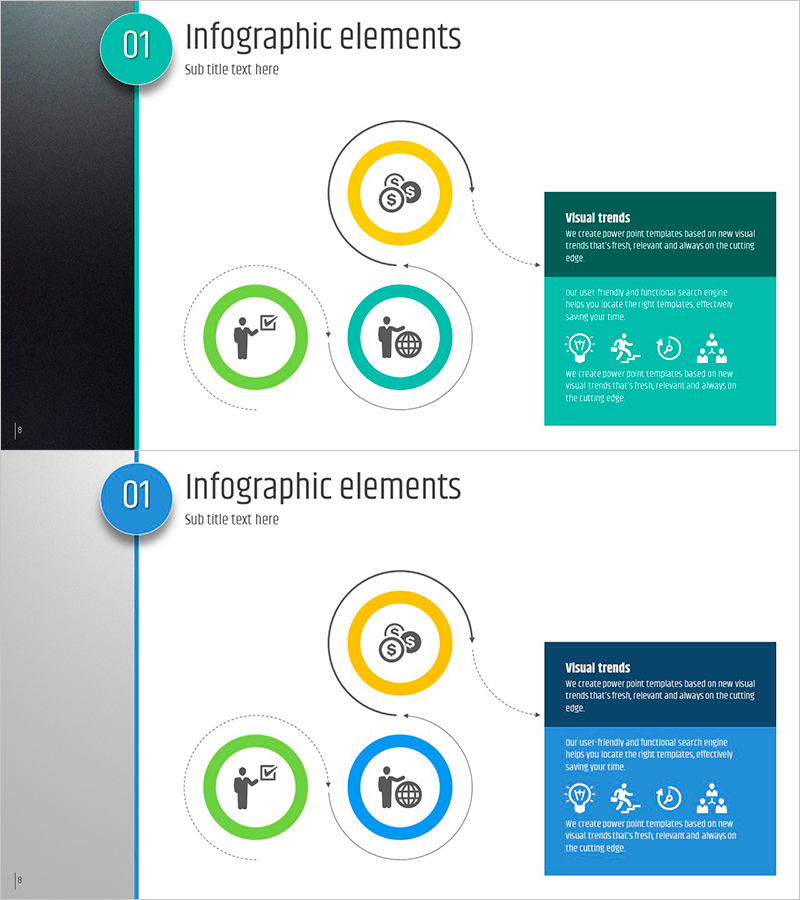
A professional circular infographic diagram PowerPoint slide featuring three interconnected nodes in teal, yellow, and green colors. Each node contains an icon placeholder and text area for customization, connected by a central vertical timeline with dotted lines showing relationships. The right side includes a dark-colored text box for additional descriptions and details. This 2-slide deck (16:9 aspect ratio) is fully editable and ready for immediate use in business presentations, strategy discussions, marketing pitches, and process explanations.
Usage Points
-
Main Usage
Visualize business concepts, processes, or strategies by breaking them into three core elements. The circular node structure emphasizes equal importance across all three components, while the central timeline suggests sequential flow or progression. Ideal for explaining marketing strategies, organizational functions, product features, or any three-pillar framework.
-
How to Use
Replace the placeholder icons with relevant symbols matching your industry or topic. Enter your title and description text in each node's text area. Customize the right-side text box with detailed explanations to enhance audience understanding. Adjust colors to match your corporate brand guidelines. Both slides follow the same structure for consistent messaging throughout your presentation.
-
Recommended For
Marketing professionals, strategy planners, product managers, and educators presenting core concepts. Perfect for investor pitches, business plan presentations, product launches, organizational structure explanations, and training seminars where visual clarity and audience engagement are critical.
-
Slide Structure
Two-slide deck with identical layout. Each slide features a left vertical timeline with teal circular numbered badge, three central circular nodes (yellow, green, teal) connected by dotted lines, and a right-side dark-colored text box. Each node contains an icon placeholder and text input area for customization.
Related Products
-

Boards and Infographics Slide – Efficient Flow and Intuitive Structure
#Product/Service Introduction #Technical Approach #Diagram
-

Main Service Composition – System and Service Diagram
#Technical Approach #Diagram #Service Components
-

System Configuration Diagram for Each Business Step
#Business Strategy #Business Management #Technical Approach
-

Urban Energy Management System Framework Slide
#Technical Approach #Diagram #Service Components
