Boards and Infographics Slide – Efficient Flow and Intuitive Structure
RJ0600071_17
- Last Update 07/09/2025
- File Size 2.4MB
- # of Slides 2
- File Format PPTX
- Slide Ratio 16:9
- Color
Keywords
- #Content-Based Slides
- #Design-Based Slides
- #Product/Service Introduction
- #Technical Approach
- #Diagram
- #Product/Service Introduction
- #Service Components
- #Flow
- #Cluster
- #Linear Flow
- #Chain Diagram
- #16:9
- #connection diagram PowerPoint
- #two-stage flowchart template
- #board infographic slide
- #technical process diagram
- #gray tone diagram design
- #how to create connection diagram in PowerPoint
About the Product
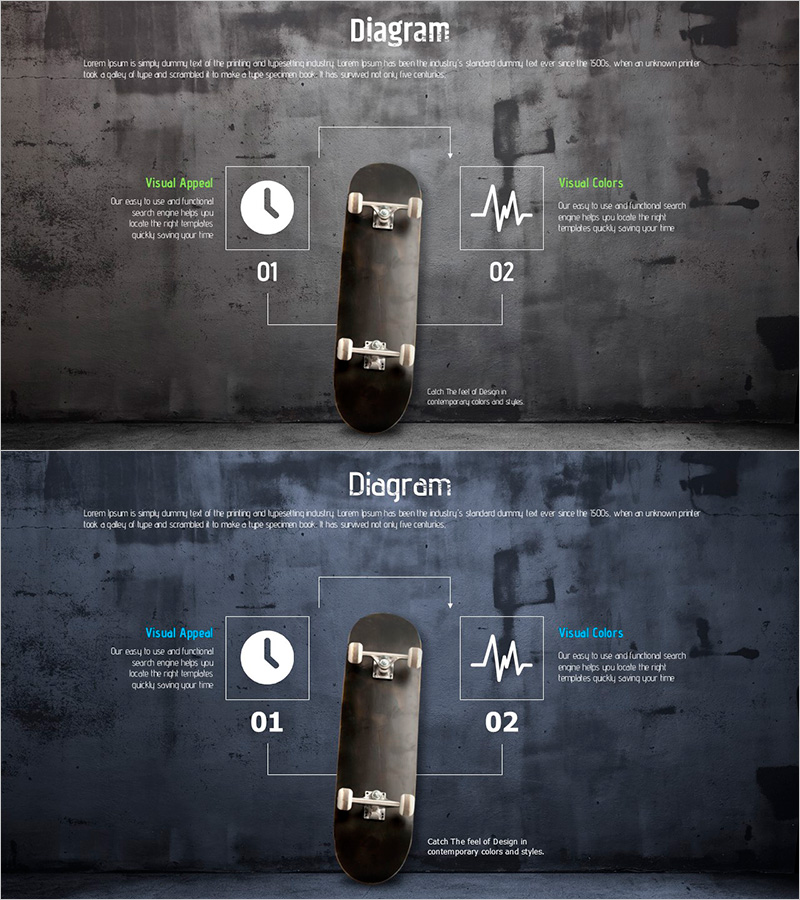
A two-stage connection diagram PowerPoint slide with a central image flanked by left and right nodes linked by directional arrows. Dark gray background contrasts with white-bordered boxes and green text labels, creating clear visual hierarchy and information flow. Ideal for technical explanations, product architecture, and process visualization. The board-style layout combines visual structure with data communication in a single composition. Two-slide set in 16:9 widescreen PPTX format, fully editable for custom content.
Usage Points
-
Main Usage
Visualize technical architecture, product composition, and process flows with clarity. The central-image-with-flanking-nodes structure effectively communicates cause-effect, input-output, and core-detail relationships in a single, unified composition.
-
How to Use
Insert product photos, logos, or icons in the central image area. Add feature descriptions, benefits, or technical specifications in the left and right text boxes. The balanced text-to-image ratio prevents information overload while maintaining professional presentation standards.
-
Recommended For
Technology presentations, software product launches, manufacturing process documentation, engineering briefings, system architecture diagrams, and proposal decks. Ideal for technical teams, product managers, business development, and engineering departments requiring data-driven visual communication.
-
Slide Structure
Two-slide template featuring a central rectangular image frame with two flanking input boxes (white borders, green labels) on left and right. Directional arrows connect the nodes. Dark gray background with high-contrast white and green elements ensures readability and visual impact.
Related Products
-

Meat Analysis Overlapping Diagram - Product and Service Introduction
#Product/Service Introduction #Technical Approach #Diagram
-

Aurora Camping Business Goal Diagram – Clear Vision Communication
#Company Introduction #Product/Service Introduction #Diagram
-

Arrow Bundle Diagram – Technology Sector and Service Differentiation Strategy
#Product/Service Introduction #Technical Approach #Diagram
-

Product Introduction Diagram – Harmony of Blue and Yellow
#Product/Service Introduction #Diagram #Product/Service Introduction
