Share Analysis of Two Topics with Pie Chart
RB0800045_6
- Last Update 03/25/2025
- File Size 0.3MB
- # of Slides 2
- File Format PPTX
- Slide Ratio 4:3
- Color
Keywords
- #Content-Based Slides
- #Design-Based Slides
- #Market and Competitor Analysis
- #Diagram
- #Graph
- #Market Share
- #Market Analysis
- #Flow
- #Circles
- #Linear Flow
- #Pie Chart
- #4:3
- #pie chart PowerPoint slide
- #circular graph template
- #market share analysis
- #two-segment pie chart
- #ratio comparison presentation
- #pie chart slide design
About the Product
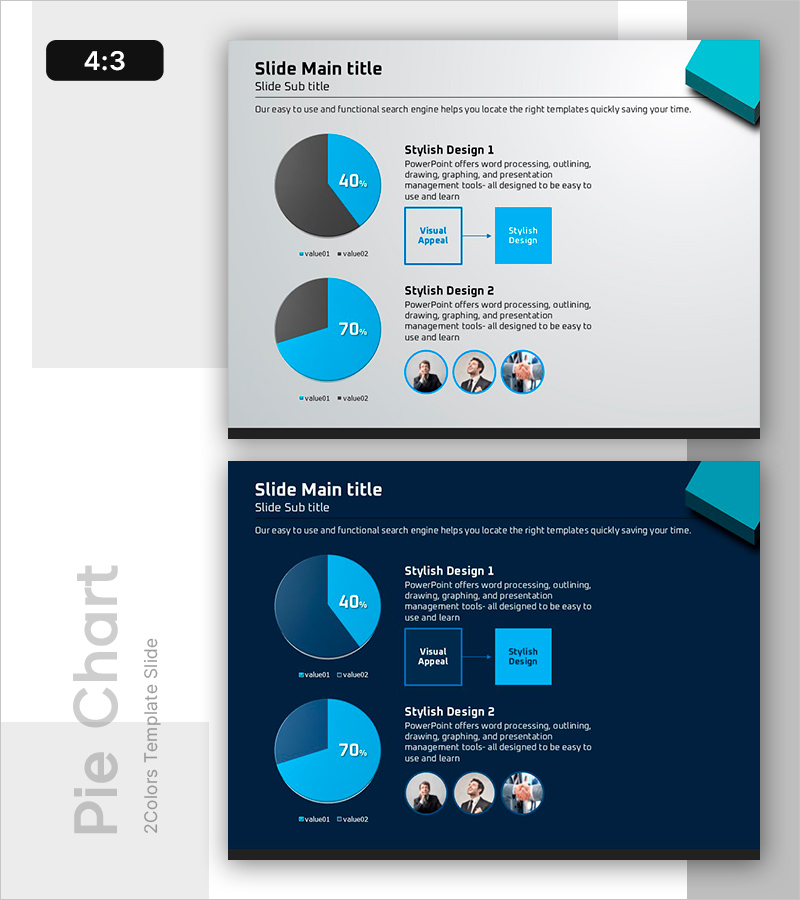
A professional PowerPoint slide featuring two pie charts for comparing market share and distribution across different categories. The design uses a light gray and turquoise two-tone background with 40% and 70% pie charts positioned on the left side, each with clear legends and data labels below. The right section includes two connected text boxes labeled 'Visual Appeal' and 'Stylish Design' with arrow connectors, while the bottom displays three circular team member profile images. This 4:3 ratio, 2-slide template is ideal for presenting business metrics such as market penetration, customer segmentation, revenue distribution, and competitive analysis in presentations.
Usage Points
-
Main Usage
Visually compare and analyze the distribution and proportion of two different categories or metrics simultaneously. Effectively communicate market share percentages, customer segment ratios, product sales distribution, budget allocation, and competitive positioning through intuitive pie chart visualization.
-
How to Use
Replace the sample percentages (40%, 70%) with your actual data values. Update the legend text (value01, value02) with your category names. Edit the right-side text boxes to include your analysis findings or key insights. Substitute the profile images at the bottom with your team member photos for a personalized presentation.
-
Recommended For
Marketing managers, sales directors, business analysts, consultants, and executives preparing quarterly reports, investor presentations, strategic planning meetings, and competitive analysis briefings. Ideal for presenting market research findings, customer demographics, departmental performance, and resource allocation.
-
Slide Structure
Both slides feature identical layout: left side contains two pie charts (40% and 70% distribution with dual data series), right side has two connected text boxes with arrow connectors, bottom section displays three circular profile image placeholders. 4:3 aspect ratio, fully editable PPTX format with all elements customizable.
Related Products
-

Market Analysis by Year Pie Chart – Emphasizing Market Share
#Market and Competitor Analysis #Graph #Market Share
-

Market Share Analysis of European Countries – Insights for Market Analysis
#Market and Competitor Analysis #Graph #Other
-

Creative Line PPT Pie Chart Analysis – Visualizing Market Share
#Market and Competitor Analysis #Graph #Market Share
-

Sailing Travel Business Market Share Pie Chart Analysis
#Market and Competitor Analysis #Graph #Market Share
