Creative Line PPT Pie Chart Analysis – Visualizing Market Share
RB0800048_6
- Last Update 03/26/2025
- File Size 1.4MB
- # of Slides 2
- File Format PPTX
- Slide Ratio 4:3
- Color
Keywords
About the Product
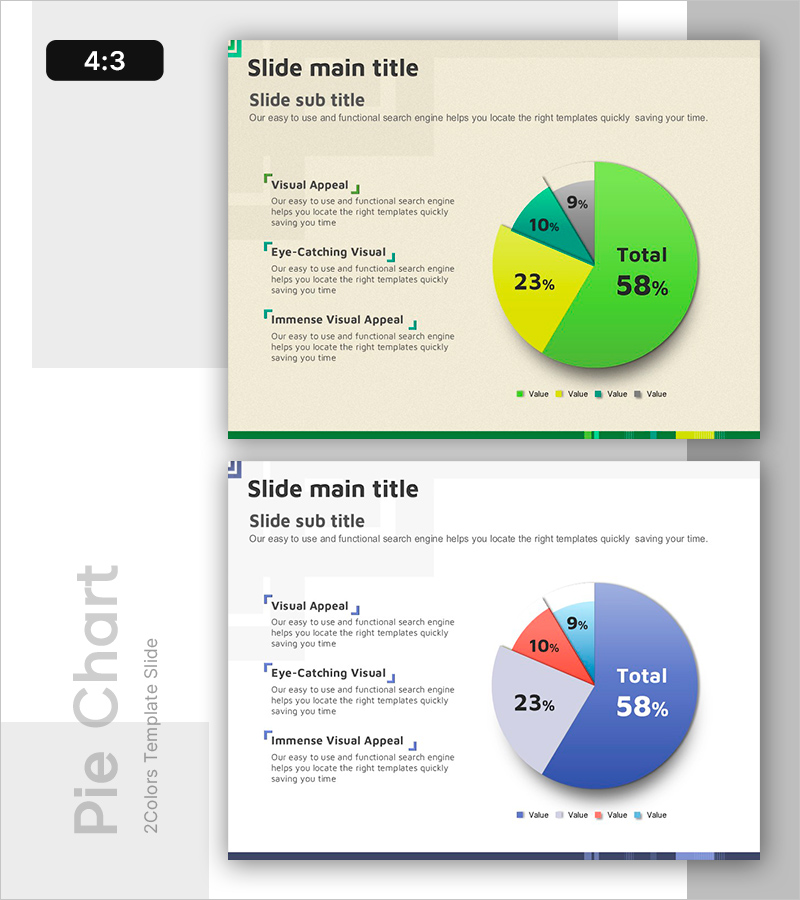
A 4-segment pie chart PowerPoint slide that intuitively visualizes market share and data ratios. The circular chart features green, yellow, teal, and gray segments on a cream background, clearly showing the proportion of each item. The left text area accommodates descriptions for three items alongside the chart, while a legend at the bottom identifies each segment. This 2-slide presentation template is ready to use for various data analysis presentations and business reports.
Usage Points
-
Main Usage
Clearly express the proportion of each item relative to the whole, such as market share, sales distribution, customer composition, and budget allocation. The 4-segment pie chart serves as a comparative analysis and decision-making tool, with the left text area allowing detailed explanation of each item's significance.
-
How to Use
Replace the chart segments and percentages with your own data, then input item names and descriptions in the left text boxes. Use the legend to clearly identify each segment, and adjust background colors and text sizes to match your presentation context. The 2-slide format allows you to repeat the same chart structure or modify it with different data.
-
Recommended For
Ideal for marketing analysis, sales reports, financial presentations, and market research findings. Suitable for executive briefings, investor presentations, team meetings, and client proposals where data-driven communication is essential.
-
Slide Structure
2-slide set with each slide featuring a 4-segment pie chart (green 58%, yellow 23%, teal 10%, gray 9%) and three text boxes on the left. A legend at the bottom identifies each segment, with a cream background and green accent line creating a unified design.
Related Products
-

Market Analysis Report Visualized with Pie Chart
#Market and Competitor Analysis #Diagram #Graph
-

Market Share Circle Graph – Ideal for Market Analysis
#Market and Competitor Analysis #Graph #Market Share
-

Market Share Visualization of Three Countries – Effective Data Analysis
#Market and Competitor Analysis #Graph #Other
-

App Payment Service Market Analysis Graph – Visualizing Market Share
#Market and Competitor Analysis #Graph #Market Share
