Market Share Circle Graph – Ideal for Market Analysis
RJ0600004_8
- Last Update 06/22/2025
- File Size 3.4MB
- # of Slides 2
- File Format PPTX
- Slide Ratio 16:9
- Color
Keywords
About the Product
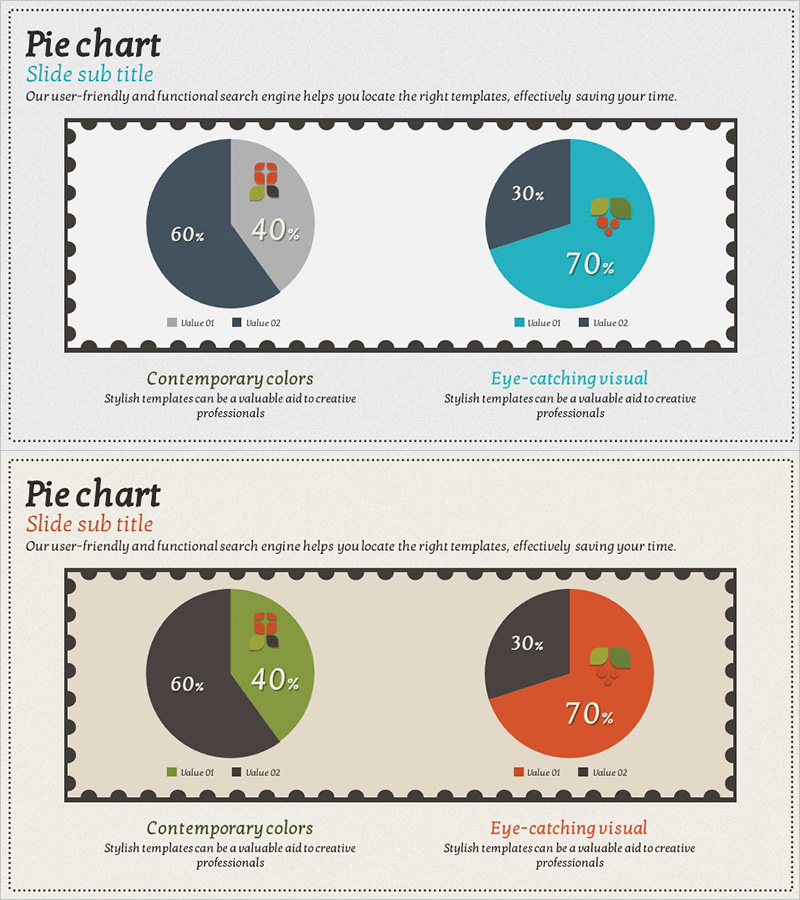
A 2-slide PowerPoint presentation featuring pie charts designed for market share and competitive analysis. The first slide uses dark gray, light gray, and orange tones to display a 60% vs 40% ratio, while the second slide combines dark gray and teal to visualize a 30% vs 70% composition. Each chart includes legends and icons for immediate use in business presentations and marketing plans. Available in 16:9 widescreen PPTX format with fully editable colors and data values for customization.
Usage Points
-
Main Usage
Visualizes two-item ratio comparisons such as market share, sales distribution, customer composition, and budget allocation using pie charts. Serves as a core visualization tool in executive reports, marketing plans, and business analysis documents to support data-driven decision-making.
-
How to Use
Double-click the pie chart values and legends to replace them with your actual data. Adjust colors by selecting theme colors from the Design tab or right-clicking individual segments to change fill colors. Icons and text labels can be freely moved or deleted as needed.
-
Recommended For
Ideal for executives, finance teams, marketing departments, and sales teams presenting quarterly results, market analysis, competitor comparisons, and customer segmentation strategies. Suitable for investor presentations, board meetings, and client pitches where credible data visualization is essential.
-
Slide Structure
Slide 1: Dark gray (60%) and light gray (40%) 2-segment pie chart with legend and icon / Slide 2: Dark gray (30%) and teal (70%) 2-segment pie chart with legend and icon. Each slide includes title and subtitle areas alongside the chart visualization.
Related Products
-

Detailed Regional Analysis Chart – Market Share Visualization
#Market and Competitor Analysis #Graph #Market Share
-

Market Analysis by Year Pie Chart – Emphasizing Market Share
#Market and Competitor Analysis #Graph #Market Share
-

Market Share Analysis Graph – Effective Market Insights
#Market and Competitor Analysis #Graph #Market Share
-

Analysis by Pie Chart Item – Visualizing Market Share
#Market and Competitor Analysis #Graph #Market Share
