Pie Chart Performance Analysis – Visualizing Market Share
RB0800049_5
- Last Update 03/26/2025
- File Size 2.8MB
- # of Slides 2
- File Format PPTX
- Slide Ratio 4:3
- Color
Keywords
About the Product
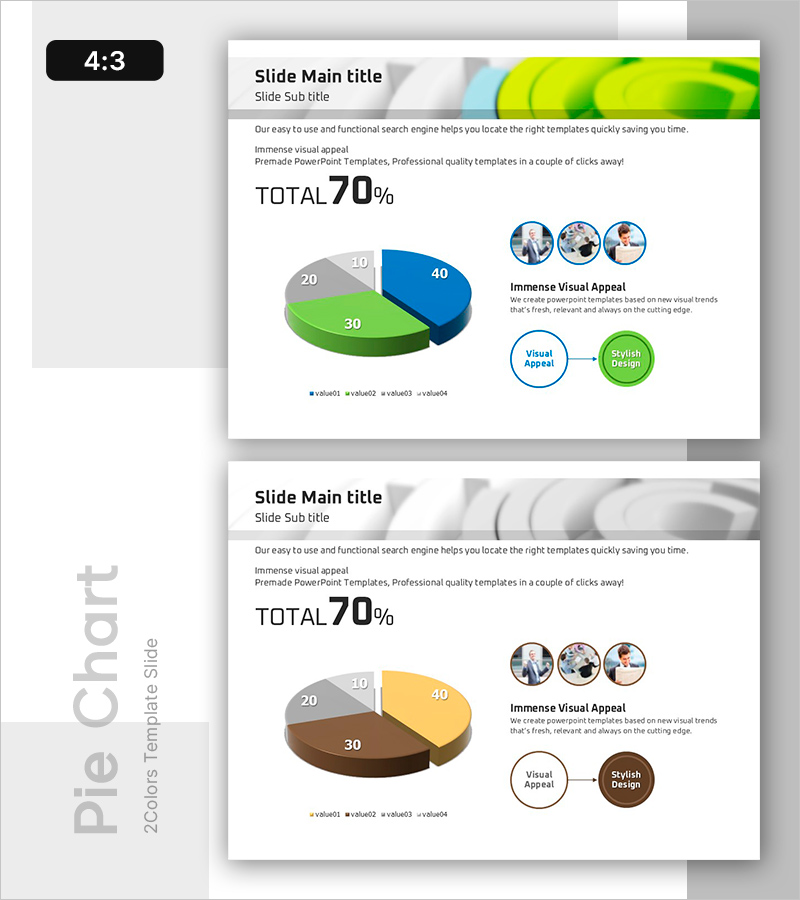
A 2-slide set featuring pie charts that visualize the proportion of four data segments. This PowerPoint template is fully editable and ideal for presenting market share, revenue composition, customer distribution, and other ratio-based data. The first slide uses blue, green, gray, and beige colors to distinguish each segment, with circular icons and text boxes positioned to the right for additional context. The second slide presents the same structure with alternative color schemes (beige, brown, gray, yellow). Perfect for business reports, market analysis presentations, and performance reviews.
Usage Points
-
Main Usage
Clearly express the proportion of each item relative to the whole using pie charts—ideal for market share, revenue breakdown, and customer distribution data. The four color-coded segments enable quick comparative analysis, making it perfect for performance and market analysis presentations.
-
How to Use
Double-click the chart in PowerPoint to edit the data values; the pie chart updates automatically. Customize the legend and text boxes to match your presentation content, and adjust colors as needed with simple formatting options.
-
Recommended For
Executives, marketing teams, sales professionals, analysts, and consultants presenting quarterly performance reports, market analysis, business reviews, and investor presentations. Especially effective when emphasizing ratio-based data and comparative metrics.
-
Slide Structure
2-slide layout: Slide 1 features a 4-segment pie chart (40%, 30%, 20%, 10%) with text area on the right / Slide 2 uses the same structure with alternative colors (beige, brown, gray, yellow). Each slide includes 3 circular icons and 2 circular text boxes for supplementary information.
Related Products
-

Share Analysis of Two Topics with Pie Chart
#Market and Competitor Analysis #Diagram #Graph
-

Modern Blue Pie Chart Template – Market Share Analysis
#Market and Competitor Analysis #Diagram #Graph
-

Pie Chart Analysis and Table – Visualizing Market Share
#Market and Competitor Analysis #Diagram #Graph
-

Performance Analysis Pie Chart – Market Share Visualization
#Market and Competitor Analysis #Diagram #Graph
