Breaking Sales Records – Visualizing Performance
RB0800026_5
- Last Update 03/23/2025
- File Size 1.1MB
- # of Slides 2
- File Format PPTX
- Slide Ratio 4:3
- Color
Keywords
- #Content-Based Slides
- #Design-Based Slides
- #Business Strategy
- #Financial Plans and Performance
- #Graph
- #Achievements
- #Sales and Revenue
- #Column
- #Column Chart
- #4:3
- #vertical bar chart PowerPoint
- #bar graph slide template
- #sales performance visualization
- #revenue comparison chart
- #data visualization slides
- #how to create bar chart in PowerPoint
About the Product
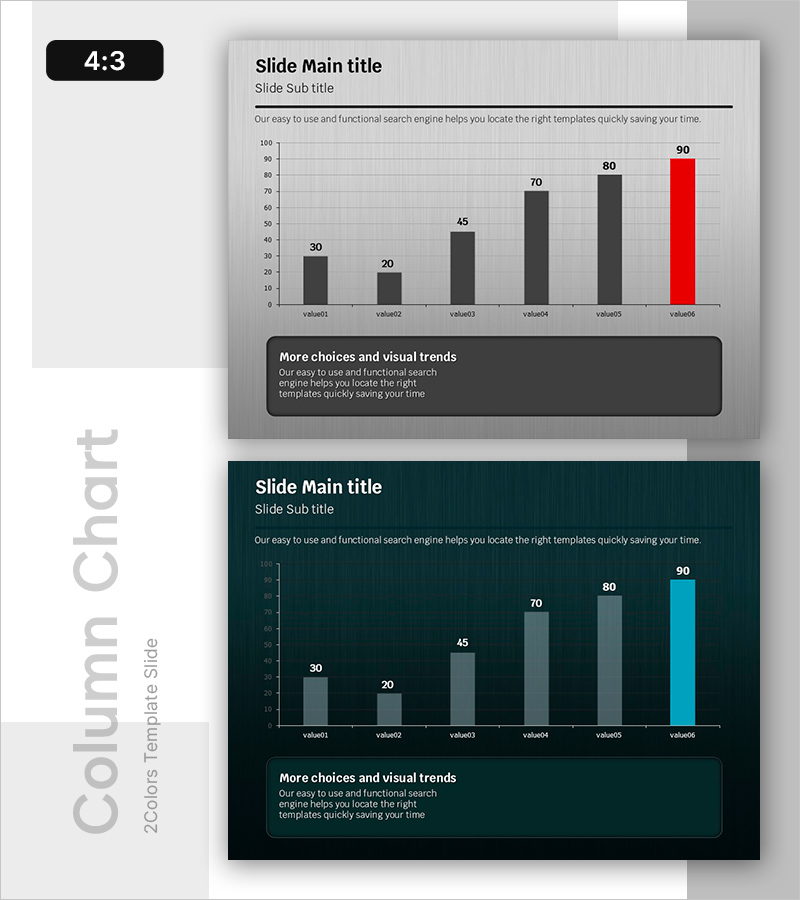
A vertical bar chart PowerPoint slide designed to compare sales performance across six stages. The chart clearly visualizes numerical data with the final item highlighted in red to emphasize peak achievement. The light gray background with black text ensures excellent readability and professional appearance. This 4:3 ratio, 2-slide template is ready to use immediately for sales reports, performance presentations, and business strategy discussions.
Usage Points
-
Main Usage
Designed to compare and visualize sales figures, revenue records, and business performance across multiple periods or categories. The vertical bar format makes relative size comparison intuitive, while the red highlight draws attention to the highest-performing item.
-
How to Use
Use in sales reports, quarterly business reviews, investor presentations, and performance briefings. Simply modify the bar heights and colors to match your actual data, then update the title and legend to fit your presentation context.
-
Recommended For
Ideal for sales team presentations, executive briefings, investor meetings, and quarterly business reviews. Particularly suited for sales managers, executives, financial analysts, and business development professionals who need to present data-driven insights.
-
Slide Structure
Slide 1 features a title area and six vertical bars (value01–value06) with the final bar highlighted in red. Slide 2 includes supplementary text boxes and additional information areas. The 4:3 aspect ratio is optimized for projectors and screen sharing.
Related Products
-

Analysis of Factors Contributing to Excellent Sales Performance – Visualizing Success
#Business Strategy #Financial Plans and Performance #Graph
-

Renewable Energy Bar Graph – Performance and Strategy
#Business Strategy #Financial Plans and Performance #Graph
-

Square Frame Template Column Chart – Business Performance Report
#Business Strategy #Financial Plans and Performance #Graph
-

Blue Column Chart – Visualizing Sales Performance
#Business Strategy #Financial Plans and Performance #Graph
