Analysis of Factors Contributing to Excellent Sales Performance – Visualizing Success
RB0800025_13
- Last Update 03/22/2025
- File Size 0.2MB
- # of Slides 2
- File Format PPTX
- Slide Ratio 4:3
- Color
Keywords
- #Content-Based Slides
- #Design-Based Slides
- #Business Strategy
- #Financial Plans and Performance
- #Graph
- #Text Box
- #Achievements
- #Sales and Revenue
- #Column
- #Column Chart
- #Rectangle Text Box
- #4:3
- #vertical bar chart PowerPoint
- #sales performance analysis slide
- #financial data visualization
- #comparison bar graph PPT
- #business performance presentation
- #revenue analysis slide template
About the Product
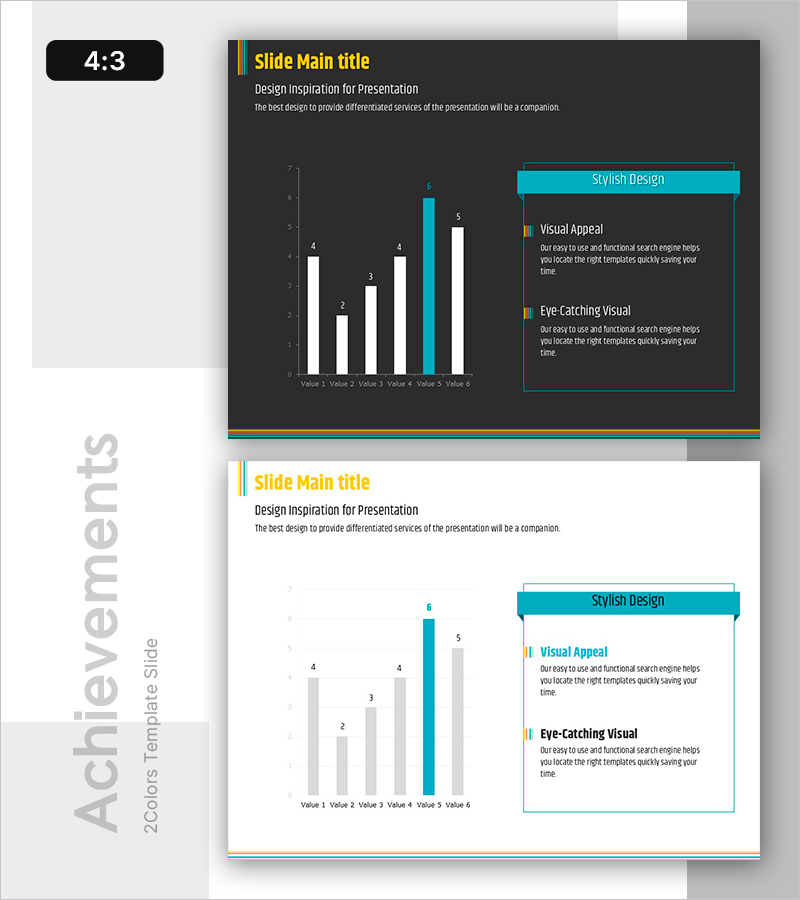
A PowerPoint slide optimized for sales performance analysis and financial data visualization. The dark background features a 6-item vertical bar chart with a cyan accent bar and white comparison bars, clearly contrasting top-performing factors. A text box area on the right side allows you to organize key insights alongside the visual data. This 4:3 ratio, 2-slide presentation template is ready to use for business strategy updates, financial planning, performance reports, and various corporate presentations.
Usage Points
-
Main Usage
Compares and analyzes numerical data such as sales revenue, sales figures, and financial indicators. The 6-item bar chart displays values through bar height, making relative size and ranking instantly clear. The cyan accent bar highlights key performance metrics for visual emphasis.
-
How to Use
Input actual sales and performance figures in the left graph area, then write analysis results and insights in the right text box. The dark background ensures high readability during projector presentations, while the cyan accent visually emphasizes core performance achievements.
-
Recommended For
Ideal for finance team reports, sales department presentations, executive briefings, quarterly and annual performance reviews, business planning meetings, investor presentations, and management analysis documents. Particularly effective when highlighting top-performing factors.
-
Slide Structure
2-slide set. Slide 1 features a 6-item vertical bar chart (1 cyan accent bar, 5 white comparison bars) with a right-side text box area. Slide 2 provides an alternative layout with the same design. 4:3 ratio PPTX format compatible with all PowerPoint versions for easy editing.
Related Products
-

Vertical General Bar Chart – Clear Performance Analysis
#Business Strategy #Financial Plans and Performance #Graph
-

Analysis by Figures with Horizontal Bar Chart – Data-Driven Market Strategy
#Business Strategy #Market and Competitor Analysis #Graph
-

Renewable Energy Bar Graph – Performance and Strategy
#Business Strategy #Financial Plans and Performance #Graph
-

Square Frame Template Column Chart – Business Performance Report
#Business Strategy #Financial Plans and Performance #Graph
