Gradient PowerPoint Template for Horizontal Bar Segmentation Graph
RJ0200060_16
- Last Update 04/16/2025
- File Size 0.3MB
- # of Slides 2
- File Format PPTX
- Slide Ratio 16:9
- Color
Keywords
- #Content-Based Slides
- #Design-Based Slides
- #Business Introduction
- #Financial Plans and Performance
- #Graph
- #Sales and Revenue
- #Horizontal Bar
- #Segmented Horizontal Bar
- #16:9
- #horizontal bar chart PowerPoint
- #segmented graph slide
- #data comparison template
- #gradient chart PPT
- #financial performance presentation
About the Product
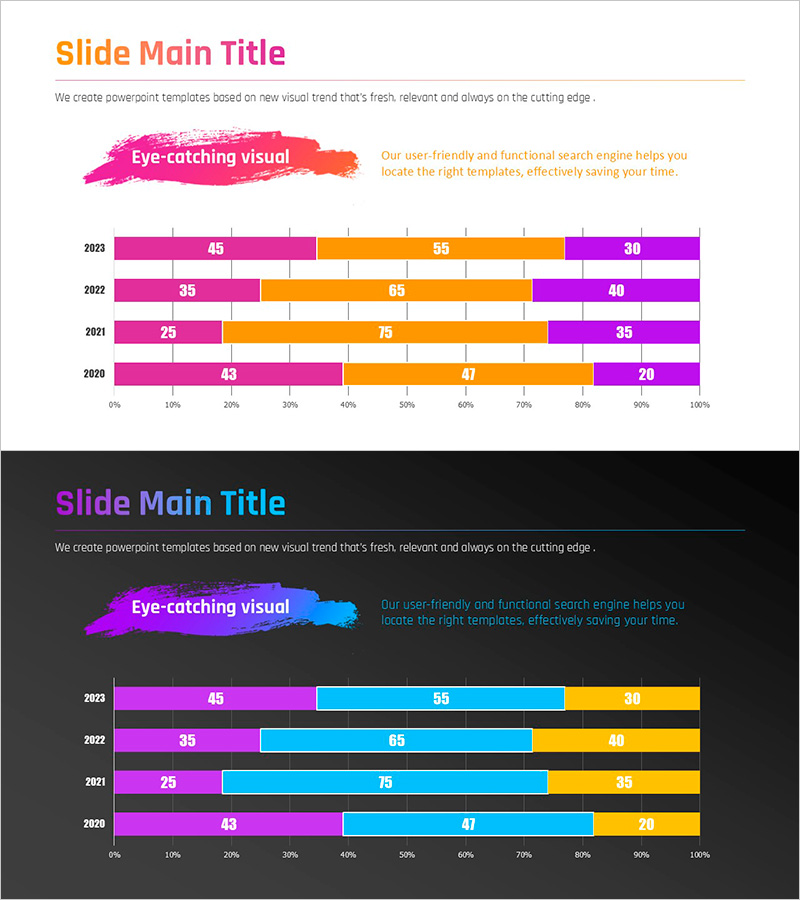
A horizontal bar segmented chart PowerPoint slide comparing four data series across years 2023 to 2020. Each series is distinguished by magenta, orange, and purple gradient colors, enabling clear year-over-year analysis at a glance. Ideal for financial performance reports, business overview presentations, and marketing analytics. Provided in 16:9 widescreen PPTX format with fully editable colors and values. Perfect for executives, finance teams, and business analysts presenting multi-dimensional data in professional settings.
Usage Points
-
Main Usage
Visualize multi-dimensional data across years, departments, or categories using segmented horizontal bars. The distinct gradient colors make complex numerical information intuitive and easy to interpret. Optimized for financial results, departmental performance, marketing channel ROI, and business unit comparisons.
-
How to Use
Open the slide and replace existing values with your data. Bar lengths adjust automatically, and colors can be modified from the theme palette. Edit year labels, category names, and legend text directly in text boxes for quick customization to any presentation context.
-
Recommended For
Finance teams presenting quarterly or annual performance reviews, sales teams analyzing regional or product sales, marketing teams reporting channel and campaign performance, and executives reviewing business unit results. Suitable for any data-driven business presentation requiring multi-series comparison.
-
Slide Structure
Two-slide set. First slide features a light background with magenta, orange, and purple gradient bars (4 bars for 2023–2020), each segmented into 3 data series. Second slide presents the same structure on a dark background with magenta, cyan, and orange gradients, providing flexibility for both light and dark presentation themes.
Related Products
-

Analysis of Fish and Fruit Intake – Market Status and Performance
#Market and Competitor Analysis #Financial Plans and Performance #Graph
-

Construction Progress Chart – Business Introduction and Market Analysis
#Business Introduction #Market and Competitor Analysis #Graph
-

Blue Green Stacked Bar Chart – Market Trend Analysis
#Business Introduction #Market and Competitor Analysis #Graph
-

Science Experiment Analysis Circular Graph Table Chart – Innovation in Data Visualization
#Business Introduction #Technical Approach #Diagram
